Introduction
Memory Bandwidth Monitoring (MBM), as introduced in the first article in this series, extends Cache Monitoring Technology (CMT) to provide per-thread memory bandwidth visibility.
This article provides an overview of the key MBM usage cases, while subsequent blogs discuss proof points and software support. The first blog in the series provides an overview of the MBM feature and basic architecture.
MBM is part of a larger series of technologies called Intel® Resource Director Technology (Intel® RDT). More information on the Intel RDT feature set can be found here, and an animation illustrating the key principles behind Intel RDT is posted here.
Key Use Models
The MBM feature enables a variety of new characterization usages and enables improved scheduling in multi-processor environments.
One example usage, the AppFormix Dashboard*, surrounds real-time container or virtual machine (VM) monitoring. This monitoring tool is part of a set of AppFormix orchestration tools supporting Kubernetes* containers and OpenStack* plug-ins. As shown Figure 1, this monitoring framework enables real-time tracking of memory bandwidth for running containers or VMs, allowing for instance visualization of whether an application is using reasonable amounts of shared resources such as memory bandwidth.

Figure 1: Data shown as a time series to enable real-time monitoring of containers or VMs. The x-axis shows time of day, and the y-axis shows memory bandwidth in MB/s. Data courtesy of AppFormix.
As MBM provides monitoring of remote memory bandwidth (via subtracting local from total) the bandwidth that applications are using to remote processors can be tracked (see Figure 2).
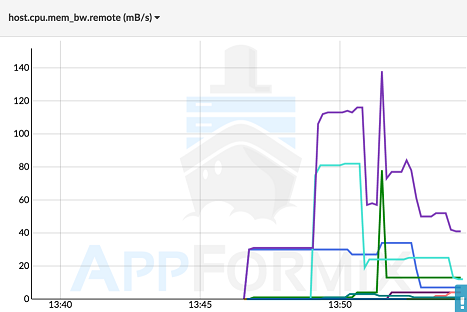
Figure 2: MBM can also track bandwidth consumed to remote processors, meaning scheduling across sockets can be monitored and potentially improved. Data courtesy of AppFormix.
Given real-time monitoring data, operators can make faster decisions about which VMs or containers need more resources to achieve a given level of performance, and it becomes more straightforward to detect “noisy neighbors” which may slow down other VMs or containers.
Once time-series data is available, a variety of higher-level usages are possible, including combining and aggregating the memory bandwidth data with data on application performance. This allows sensitivity profiling of the application performance as a function of the amount of memory bandwidth available.
The example given in Figure 3 (for illustrative purposes only, as application characteristics will vary) shows the performance of a highly bandwidth-sensitive application, and other applications may exhibit different characteristics. The performance versus bandwidth curve can be used in a number of scenarios, including tracking performance versus goals and required resources, and debugging performance (for example, if a bandwidth-sensitive application’s performance is low, it could benefit from migrating to a processor with more bandwidth available).

Figure 3: An example bandwidth-sensitive application with performance shown as a function of memory bandwidth available. Through the combination of MBM and application performance metrics, such plots can be used to understand the characteristics of an application, which can also be combined with Cache Monitoring Technology data for a deeper understanding. Performance debug usages are also possible. As application characteristics can vary, the figure is for illustrative purposes only.
Another important usage is to enhance cross-socket scheduling in NUMA-aware systems. This topic is discussed in the next blog in the series on proof points.
More specific feature details on the capabilities and event codes provided by MBM are provided in the Intel Software Developer’s Manual.
Conclusion
MBM provides real-time data on bandwidth usage per thread, application, VM, container or any combination (given proper software support). Longer-term, these metrics can be provided to higher-level software including orchestration frameworks, enabling automated characterization and resource-aware scheduling usages. The next blog in the series provides additional examples and proof points.
"