Introduction
Both cache and memory bandwidth can have a large impact on overall application performance in complex modern multithreaded and multitenant environments. In the cloud datacenter for instance it is important to understand the resource requirements of an application in order to meet targets and provide optimal performance. Similarly, some applications may over-utilize shared resources, and the capability to detect such “noisy neighbor” applications is important. The new Memory Bandwidth Monitoring (MBM) feature helps address this issue, for the first time, by providing per-thread memory bandwidth monitoring for all threads simultaneously.
This article provides an overview of the MBM feature and architecture, while the next article in the series discusses use models. Information on proof points and software support is provided in subsequent articles.
MBM is part of a larger series of technologies called Intel Resource Director Technology (Intel RDT). More information on the Intel RDT feature set can be found here, and an animation illustrating the key principles behind Intel RDT is posted here.
What is Memory Bandwidth Monitoring (MBM)?
The prior generation Intel® Xeon® processors E5 v3 introduced Cache Monitoring Technology (CMT), which enables per-RMID (and effectively per thread, app, or VM) tracking of last-level cache (LLC) usage per thread. CMT is effective at detecting noisy-neighbors in the cache, understanding the cache sensitivity of applications, and debugging performance problems. To fully understand application behavior, however, monitoring of memory bandwidth is also needed, as some apps have low cache sensitivity due to either very small working sets (compute bound) or extremely large working sets that do not fit well in the cache (streaming applications).
The Memory Bandwidth Monitoring (MBM) feature introduced on the Intel® Xeon® processor E5 v4 family provides additional advanced telemetry by extending CMT to include new event codes per RMID. The same flexible per-thread/app/VM/container monitoring is possible, now enhanced with visibility into memory bandwidth.
Usage models are discussed in the next article in the series, including advanced workload fingerprinting and telemetry, and enhanced NUMA-aware scheduling.
Key components of Memory Bandwidth Monitoring (MBM)
MBM uses the same basic infrastructure as CMT, with new feature enumeration (via CPUID), and new event codes to retrieve memory bandwidth (sourced from local memory controllers, or from all possible sources including remote memory controllers).
The following mechanisms are shared by CMT and MBM:
- A mechanism to enumerate the presence of the RDT Monitoring capabilities within the platform (via a CPUID feature bit).
- A framework to enumerate the details of each sub-feature (including CMT and MBM, as discussed later, via CPUID leaves and sub-leaves).
- A mechanism for the OS or hypervisor to indicate a software-defined ID for each of the software threads (applications, virtual machines, etc.) that are scheduled to run on a core. These identifiers are known as Resource Monitoring IDs (RMIDs).
- Mechanisms in hardware to monitor cache occupancy and bandwidth statistics as applicable to a given product generation on a per software-id basis.
- Mechanisms for the OS or hypervisor to read back the collected metrics such as L3 occupancy or Memory Bandwidth for a given software ID at any point during runtime.
Key constructs such as Resource Monitoring IDs (RMIDs) are shared across CMT and MBM. The RMID-based infrastructure allows RMIDs to be associated flexibly with threads / apps / VMs / containers (based on software support):

Figure 1. Resource Monitoring IDs (RMIDs) can be used to track the resource usage of threads, apps, VMs or containers in a flexible manner. Software assigns RMIDs based on the specific monitoring needs.
Note that since software support is provided across multiple OSs, hypervisors, and utilities, most users and operators can benefit without using the low-level MSR-based interfaces directly; however, an overview of these interfaces is provided below to help illustrate the hardware-software interface.
As with CMT, RMIDs are assigned to threads via the IA32_PQR_ASSOC MSR:

Figure 2. The IA32_PQR_ASSOC MSR allows the RMID to be specified for a given thread.
Similarly, the monitoring data infrastructure is shared across CMT and MBM, and data can be retrieved with a simple window-based interface, where software provides an event ID and RMID and hardware provides the resulting data back in the IA32_QM_CTR MSR:
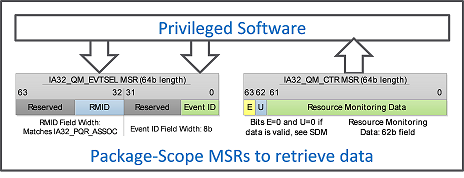
Figure 3. The IA32_QM_EVTSEL and IA32_QM_CTR MSR pair enable data retrieval, which is multiplied by an upscaling factor from CPUID to retrieve data values in bytes.
More information about IA32_QM_EVTSEL and IA32_QM_CTR MSR is available in the Intel Software Developer’s Manual.
Some attributes of MBM are unique—in particular the MBM feature provides the following:
- A mechanism to enumerate the presence and details of the MBM feature as applicable to a given level of the cache hierarchy, independent of other RDT Monitoring features (via CPUID).
- MBM-specific event codes to read bandwidth out to the next level of the hierarchy and various sub-event codes to read more specific metrics as discussed later (e.g., total bandwidth vs. bandwidth only from local memory controllers on the same package).
More specific feature details are provided in the Intel Software Developer’s Manual, and in the follow-on articles about software support.
Conclusion
Memory Bandwidth Monitoring (MBM) is an important component of the Intel Resource Director Technology (Intel RDT) feature set which plays an important role in providing additional information on the resource usage and resource sensitivity of threads/apps/VMs/containers. Usage models including detecting “noisy neighbor” applications in the datacenter are discussed in the next article in the series, including advanced workload fingerprinting and telemetry, and enhanced NUMA-aware scheduling.
Notices
No license (express or implied, by estoppel or otherwise) to any intellectual property rights is granted by this document.
Intel disclaims all express and implied warranties, including without limitation, the implied warranties of merchantability, fitness for a particular purpose, and non-infringement, as well as any warranty arising from course of performance, course of dealing, or usage in trade.
This document contains information on products, services and/or processes in development. All information provided here is subject to change without notice. Contact your Intel representative to obtain the latest forecast, schedule, specifications and roadmaps.
The products and services described may contain defects or errors known as errata which may cause deviations from published specifications. Current characterized errata are available on request.
Copies of documents which have an order number and are referenced in this document may be obtained by calling 1-800-548-4725 or by visiting /content/www/cn/zh/resources-documentation/developer.html.
Intel, the Intel logo, and Intel Xeon are trademarks of Intel Corporation in the U.S. and/or other countries.
*Other names and brands may be claimed as the property of others.
© 2016 Intel Corporation.
"