Introduction
Intel® Graphics Performance Analyzers (GPA) offers a wide range of tools to analyze graphics applications across diverse workloads, platforms, and graphics APIs. Within Intel® GPA you can use Graphics Frame Analyzer to identify and analyze problem areas in your applications to resolve GPU performance regressions. This article will dive deep into fundamental frame capture capabilities that can be configured in Graphics Monitor to aid in the future analysis of frame files in the single frame view of Graphics Frame Analyzer. Topics covered in this article can be visualized in video format in the Configure and Capture Frames Deep Dive video, by checking reference markers in the images associated with this article.
Pre-requisites
Before proceeding with this article, ensure you have the minimum system requirements to successfully analyze graphics applications using Intel® GPA.Also make sure you have downloaded and installed Intel® GPA on your host platform.
Configuring Frame Capture Methods
There are two methods of capturing a frame that can be used separately or simultaneously. These methods can be configured in the settings of Graphics Monitor by pressing the Options button to go into the settings of the tool.
Key Bindings
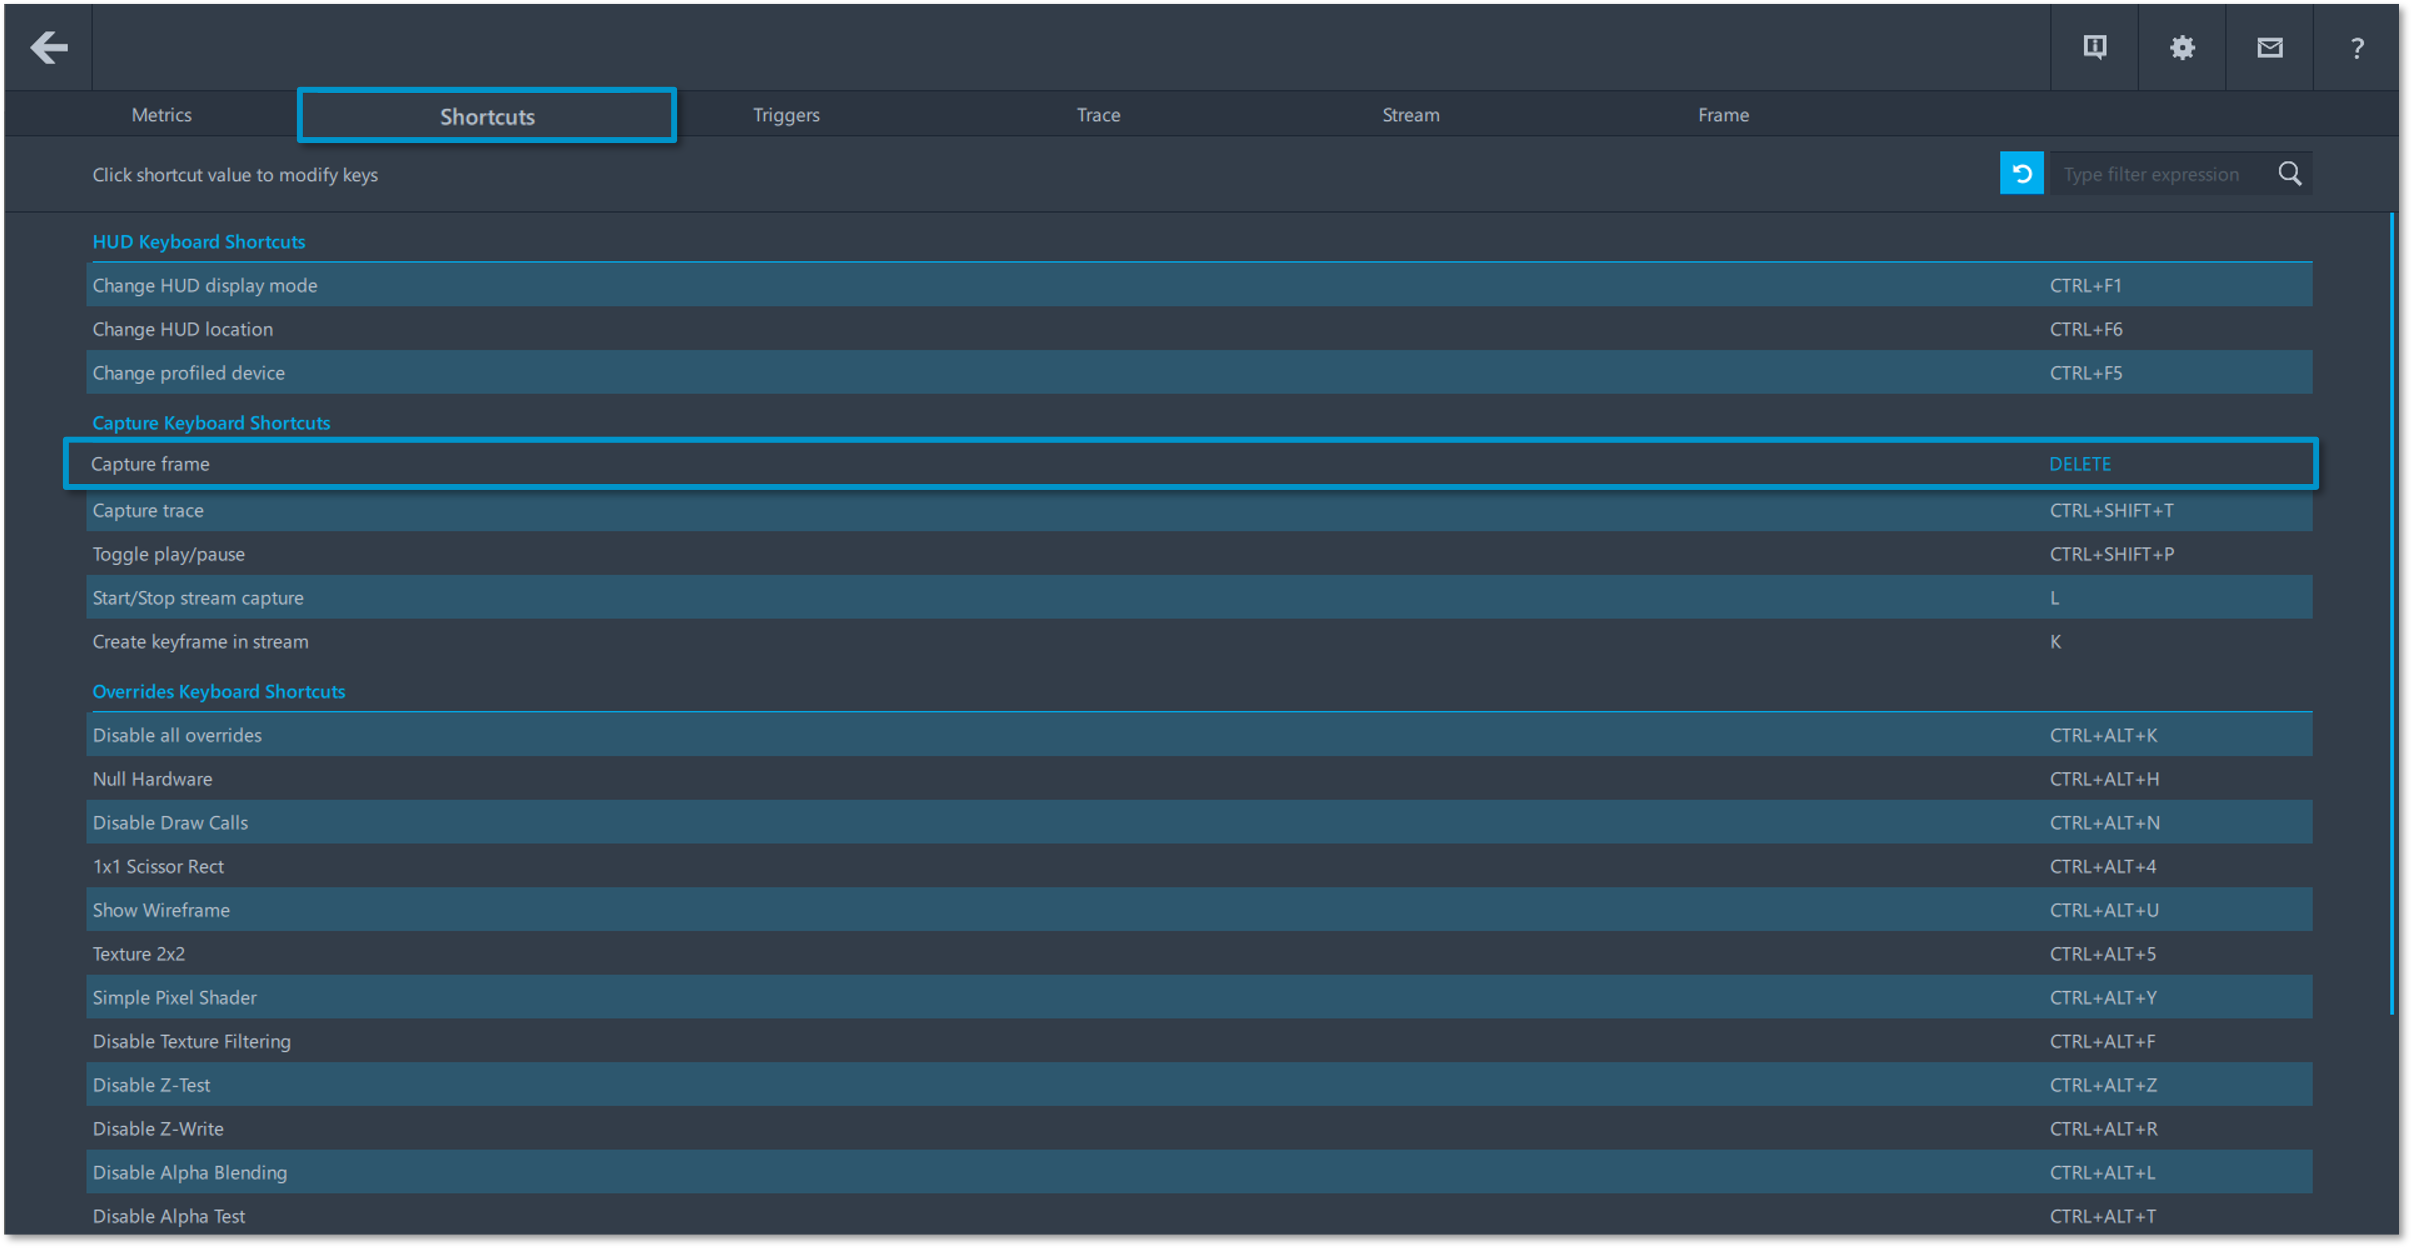
The first method allows you to manually capture a frame using a key binding on your keyboard. The default key binding to capture a frame is CTRL-SHIFT-C but this can be altered in the Shortcuts tab in the settings menu of Graphics Monitor, then by clicking on the currently bound key binding next to the Capture Frame option and then by pressing a new key binding on your keyboard to replace it.
Triggers
The second method allows you to automatically capture a frame after a user specified condition has been met. This can be defined in the Triggers tab in the settings of Graphics Monitor, then by pressing the plus [+] button to add a new trigger to your triggers list. Graphics Monitor also contains simple predefined triggers that you can modify and use by pressing the toggle button next to the trigger to enable it. Select the Frame Capture option from the drop-down menu next to the Do statement, then type in a “double quotation” in the bar next to the When statement to see all available conditions that you can use in your triggers. You can choose to use one condition per trigger or choose to use operators to combine multiple conditions into one trigger. In the Post Action drop-down menu, you can either choose to Terminate your application upon completion or Do Nothing which may result in a re-trigger after a specified time allotment. This time allotment can be altered by changing the number in seconds next to the Retrigger In statement.

Capturing a Frame
To capture a frame, exit out of the settings menu then enable frame capturing mode by selecting the Frame option from the drop-down menu next to the start button. Press the Start button to run your application within Graphics Monitor. With the application window open you can press your frame capture key binding to manually capture a frame or wait for your trigger to do it automatically. To close your target application simply exit out of the application or press the Stop button in Graphics Monitor.
Conclusion
This article demonstrated how to configure and capture a frame in Graphics Monitor to tailor your frame captures to your specific use case. For more information on how to identify and analyze problem areas in your applications to resolve GPU performance regressions continue reading the Graphics Frame Analyzer Deep Dive articles.
Additional Resources
Part 1: Configure and Capture Frames (Video)
Part 2: Configure and Capture Multiple Frames (Article)
Part 3: Open and Explore Multiple Frames (Article)
Part 4: Open and Explore a Single Frame (Article)
Part 5: Working with the Bar Chart and API Log (Article)
Part 6: Exploring the Metrics Viewer (Article)
Part 7: Inspecting a Draw Call (Article)
"