One of the new features in Intel® Trace Analyzer and Collector is the new Intel® Trace Analyzer Summary Page. This gives a high-level overview of your program’s time spent in MPI vs. time spent outside of MPI (User Code).
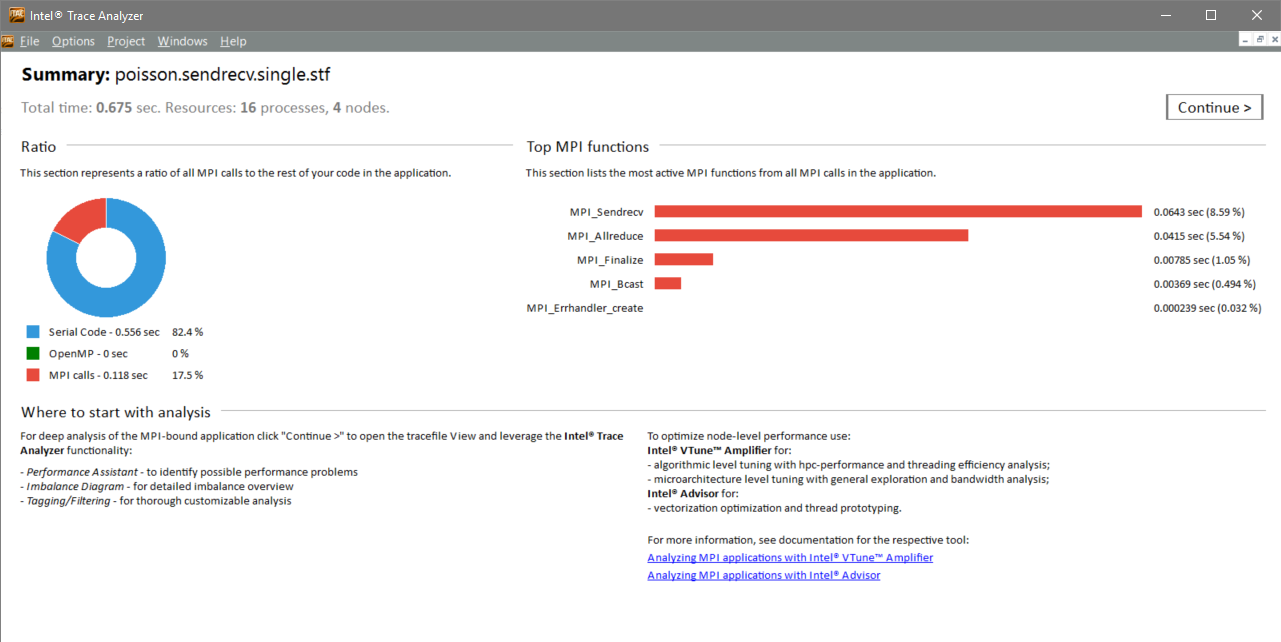
There are two methods of accessing the Summary Page. By default, it is opened whenever you open a trace. The check box at the bottom, “Show Summary Page when open tracefile”, can be used to disable or re-enable this. Once you are in the main trace view, you can click View -> Summary Page (or use the keyboard shortcut CTRL+ALT+G) to open the Summary Page.

There are four pieces of information to look for on the Summary Page. It shows total runtime as well as the number of ranks and nodes used in the run at the top. Below this is a ratio, showing the time spent in MPI calls, OpenMP*, and other code, as well as the percentages of each.
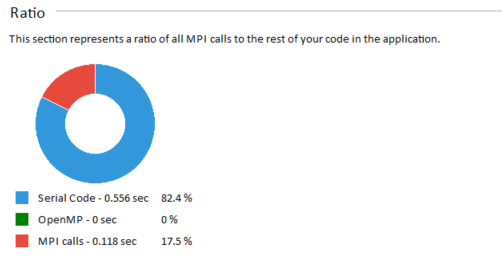
Here, you can quickly identify where to focus your efforts. If MPI is only a small percentage of your runtime, your efforts will be better spent improving the User Code performance. Intel® VTune Amplifier XE can assist with this, and the bottom of the Summary Page has a link to how to use Intel® VTune Amplifier XE with MPI codes. If your application is spending a large amount of time in MPI (as is the case here), then continue in Intel® Trace Analyzer to find potential solutions.
The next item on the Summary Page is a list of the top MPI functions. This list presents a bar graph of the most used MPI functions, based on time in function, and the percentages of your application’s runtime spent in those functions.

The top functions list provides insight for where to focus your initial MPI analysis. In this screenshot, MPI_Sendrecv and MPI_Allreduce are taking the most time. You can also see the percentage of total runtime spent in each of the top MPI functions and get an idea of potential improvements. The reason for these being the top functions isn’t apparent here, but it gives guidance for where to start searching.
At the bottom are next steps to take. If your application needs MPI improvements, you will be directed to continue in Intel® Trace Analyzer. If your application needs improvements elsewhere, you are advised to use Intel® VTune™ Amplifier XE, and there is a link to documentation about how to perform this analysis.
"