The main goal of Simics* has always been fast functional simulation: running software quickly and correctly for systems development and testing independent of physical hardware. Simics can also be used for computer architecture work, leveraging the fast models to get workloads to run, and adding architecture details when and where needed. Such added details inevitably make the model slower. In the past year, as Arianna Delsante from Uppsala University did her master’s thesis at Intel in Stockholm, she managed to make cache simulations run more than 10x† faster than before in Simics. Read on to learn more about her work.
 Arianna Delsante in front of old university main building in Uppsala. Photo by Fredrik Larsson
JE: Arianna, please introduce yourself.
AD: I am Arianna Delsante, from Italy. I have a bachelor’s degree in Computer and Electronic Engineering from University of Parma and, two years ago, I decided to move to Sweden to study Computer Science at Uppsala University.
JE: How did you end up doing your thesis at Intel?
AD: During my last year, my interest focused on computer architecture and I thought that writing my Master of Science (MSc) thesis at Intel would be a great match. I knew about Simics from university, and the possibility of working closely with it seemed to me a great opportunity.
JE: What did you do in your thesis?
AD: I worked mainly with cache simulation in Simics. Specifically, the aim of my work was to implement new ways of collecting and sharing data between the cache model and the simulated processor for minimum slowdown when computing statistics.
JE: Thank you, Arianna. Let’s explain the technology in a bit more detail, below.
Cache Simulation in Fast Virtual Platforms
Cache simulation in a fast-functional platform is typically used to compute hit and miss rates at various levels in the cache hierarchy for various cache configurations. Sometimes, the model also includes timing penalties to approximate the performance impact of the cache behavior of the code.
As it executes code, each processor core in the system generates a sequence of memory operations. They are fed into the cache model to determine hits, misses, fills, and replacements at each level of the cache. Figure 1 shows a typical setup with a couple of cores and an added cache model.
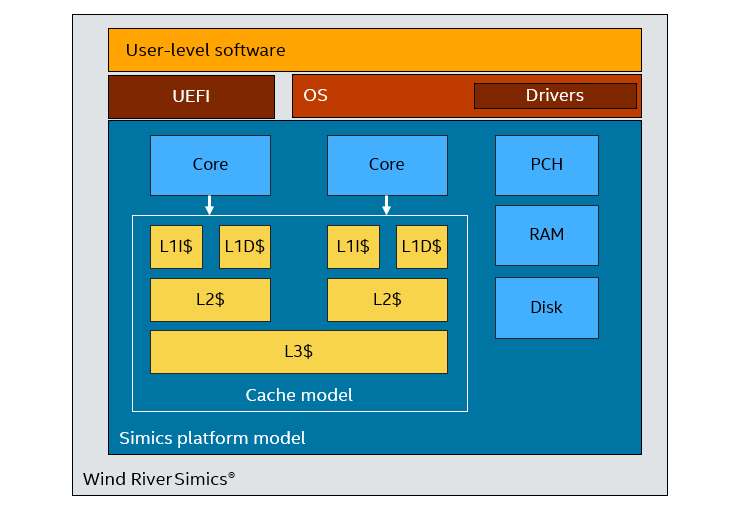
Figure 1. Cache model attached to Simics processor core models
In the past, doing this in Simics slowed down the simulation by a factor of about 100, compared to running without the cache model. This slowdown was mostly caused by the need to run the core instruction set simulator in a different mode that made all memory operations visible to the cache model – the normal fast model does a lot of caching in order to run faster, and this was at odds with the need to see all memory operations in the model. The interfaces used to see the memory operations also were not very efficient.
Reducing Cache Simulation Overhead
Arianna’s work shows that cache simulation can be performed much faster, with a slowdown of less than 10x* in many cases. She explored several different optimizations: using a better API, caching accesses to the same cache line, and batching operations.
The cost of cache simulation can be roughly split in two parts: the overhead of calling out from the instruction set simulator to the cache model, and the processing in the cache model itself. The cache model cost can vary significantly depending on its complexity.
The first part Arianna’s work focused on the overhead cost, using the Simics instrumentation API to drive the model. I have  blogged about the instrumentation API previously, showing how it was used to collect instruction type statistics. In this case, the same API is used for an entirely different purpose. Instead of looking at the opcodes of all instructions, the cache model hooks into memory operations. Other instructions are not affected by the presence of the cache model. The instrumentation API works with the processor in Just-in-Time compilation (JIT) mode. That makes it much faster than the old system that forced Simics to interpret instructions one at a time: here, the instrumentation API disturbs the execution of the instruction-set-simulator (ISS) as little as possible.
Using the Instrumentation API implementation to feed a single-level direct-mapped data cache model (the simplest cache model possible), the simulation runs between 3x and 6x times slower (compared to running in JIT with no instrumentation)*. The same workloads had a slowdown of between 70x and 150x using the old cache simulation interface*. Obviously, the precise results depend on the particular workload being used, but this is an order of magnitude speed-up for doing exactly the same work: running the same software, simulating the same cache, with the same results.
Reducing the Overhead with Batching
More can be done to reduce the overhead, however. The goal of the cache simulation Arianna worked on was to collect statistics—that has no immediate effect on the semantics of the code executing in Simics. Thus, it is feasible to decouple the cache simulation from the collection of memory accesses in the instruction-set simulator to increase performance.
Following this principle, the first optimization was to add a simple line buffer to the instrumentation code. The buffer can be considered as a level zero cache. It keeps track of successive accesses to the same cache line and does not call the cache model until a different cache line is touched. This simple optimization reduced the number of calls to the cache model by 30% and improved performance by a bit less than that (as there is still work involved in maintaining the line buffer). This is a nice example of what is possible using the Simics instrumentation API – adding inline statics collection.
The next optimization was to batch the calls to the cache model, at the level of thousands of accesses. The cache instrumentation collects a stream of accesses in a buffer and then sends it to the cache model for processing in a batch. This improves locality for both the processor simulation and the cache simulation.
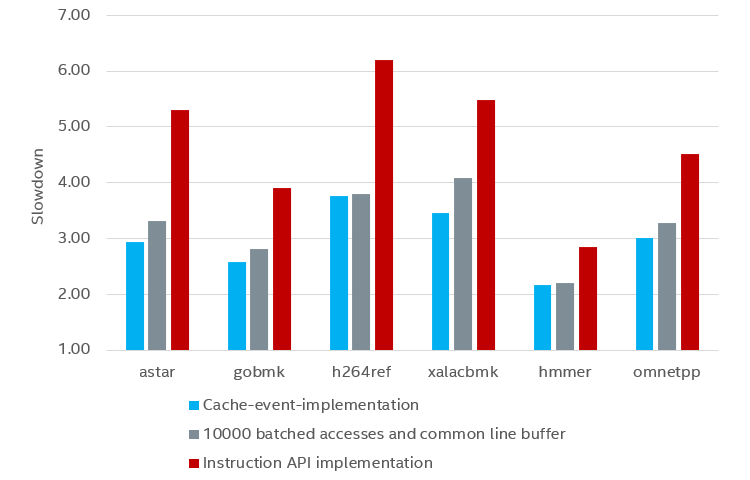
Figure 2. Effect of batching calls to the cache model, Figure 4.12 from the thesis report
Figure 2 shows the result of batching memory accesses over some Standard Performance Evaluation Corporation (SPEC*) benchmarks. Batching roughly halves the slowdown compared to the baseline of sending each memory access to the cache model. Two variants of batching are shown: the “cache-event-implementation” variant is the fastest—it sends accesses to the cache model after 10,000 instructions have been executed on the core; the “10000 batched” variant sends accesses to the cache model after 10,000 memory operations have been executed.
The “10000 batched” variant would typically send several times more memory accesses to the cache model than “cache-event-implementation” in each batch, but it still runs slower. It sounds counterintuitive, but it is due to the cost involved in counting the memory accesses. The “cache-event-implementation” variant uses existing event mechanisms in the processor model and does not need to do any counting on its own. Note that it seems that collecting cache accesses over a longer period than this does not speed things up much.
More Complex Cache Model
Another question is how the complexity of the cache model affects simulation performance. It is expected that a more complex model takes more time to execute. Arianna tried several successively more complex models in her work, with the results shown in Figure 3.
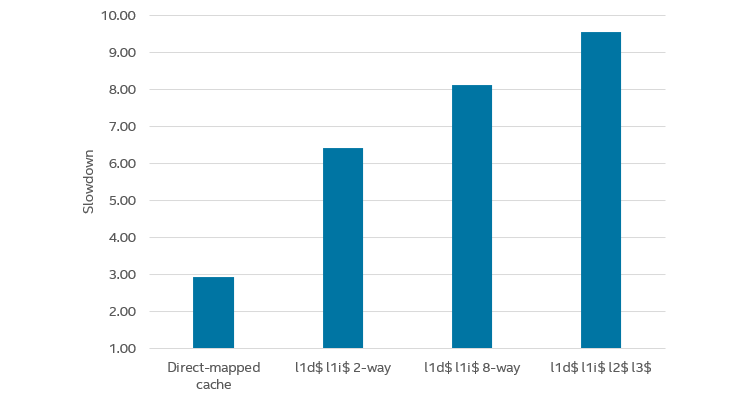
Figure 3. Performance for more complex cache models (Figure 4.17 from the thesis report)
Adding an instruction cache and making the cache 2-way set-associative increased the slowdown from 3x to 6x. Making the caches 8-way (but still single-level) increased the slowdown to about 8x, and implementing a full three-level cache hierarchy by adding a unified level 2 and level 3 cache pushed the slowdown towards 10x. This means that by using the techniques presented in the thesis, it is possible to run a full cache simulation in Simics with a slowdown of just 10x, which is a huge step forward from the technology available in earlier Simics versions.
Simulating Branch Prediction
In the second part of the thesis, Arianna applied the same principles to another simulation problem: modeling branch prediction. Branch prediction is the other “big” simulation problem: trying to bridge from a fast functional simulator to a more timing-detailed simulator—both branch predictors and caches take a long time to “warm up” from an empty state (for more, see “gem5 Full Speed Ahead”).
Doing branch prediction simulation with the Simics Instrumentation API means adding instrumentation on branch instructions. Such instrumentation is entirely orthogonal to the cache simulation. The beauty of the Instrumentation API is that each piece of instrumentation only needs to hook into the behaviors relevant for it. All other instructions executed are left alone, lowering the overhead, reducing complexity, and improving performance.
Summary
In her thesis, Arianna provided a good example for what we can with the instrumentation API in Simics beyond just watching which instructions are executed. Using the API, she implemented both cache and branch prediction simulation with a very low overhead compared to previous Simics implementations.
The thesis report is posted online here.
Related Content
Cloud, Containers, and Your Simulator: Putting simulation solutions into a cloud environment can ensure that everyone gets a consistent setup, accessed in a convenient way.
Simics* Software Automates “Cyber Grand Challenge” Validation: DARPA ran a Cyber Grand Challenge where cyber-attack and defense systems were pitted against each other to drive progress in cyber-security.
Containerizing Wind River Simics* Virtual Platforms (Part 1): Developers can gain major benefits from using containers with Wind River* Simics* virtual platforms.
Using Wind River* Simics* with Containers (Part 2): Using Wind River Simics* has advantages over using hardware for debugging, fault injection, pre-silicon software readiness, and more.
Finding BIOS Vulnerabilities with Symbolic Execution and Virtual Platforms: Intel’s Excite project uses a combination of symbolic execution, fuzzing, and concrete testing to find vulnerabilities in sensitive code.
Author
Dr. Jakob Engblom is a product management engineer for the Simics virtual platform tool, and an Intel® Software Evangelist. He got his first computer in 1983 and has been programming ever since. Professionally, his main focus has been simulation and programming tools for the past two decades. He looks at how simulation in all forms can be used to improve software and system development, from the smallest IoT nodes to the biggest servers, across the hardware-software stack from firmware up to application programs, and across the product life cycle from architecture and pre-silicon to the maintenance of shipping legacy systems. His professional interests include simulation technology, debugging, multicore and parallel systems, cybersecurity, domain-specific modeling, programming tools, computer architecture, and software testing. Jakob has more than 100 published articles and papers and is a regular speaker at industry and academic conferences. He holds a PhD in Computer Systems from Uppsala University, Sweden
†Performance Test Methodology and System Configuration
Host hardware: Workstation with one 64-bit Intel® Xeon® Processor E3-1245 v3 @ 3.40GHz, 16 GB of RAM, and 240 GB SSD.
Simics Virtual platform Software Version: Simics 5, using the Simics X86-X58-ICH10 model, with a first-generation Intel® Core® processor, running a Yocto 1.8 image (Linux* kernel version 3.14), booting from legacy BIOS.
Test workloads: 12 different performance benchmarks provided by Standard Performance Evaluation Corporation (SPEC). Each tests a different workload and cache misses. For more information, see: John L. Henning. Spec cpu2006 benchmark descriptions. SIGARCH Computer Architecture News, 34(4):1–17, September 2006.
"