Every game developer who wants to achieve high frame rates across diverse platforms will eventually confront the challenge of optimizing for the CPU and GPU. GameDev, SegmentNext, and WePC have all written extensively about that challenge and the issues involved. There is help at hand, however: detailed, specific recipes available to optimize your game for Intel® hardware. And if you intend to follow those recipes for optimization, you should consider a free tool designed specifically for that purpose – Intel® Graphics Performance Analyzers (Intel® GPA).
Intel GPA offers multiple lines of inquiry to solve bottlenecks by visualizing the execution profile of the tasks in your code. You can view the profile on the entire platform over time, on both the CPU and GPU. This helps you understand task-based issues within your game, enabling you to optimize the computational and rendering tasks so no resources are idle. You can also use the trace data collected during the application run to provide a detailed analysis of how your code executes across all threads, and correlate the CPU workload with that on the GPU.
CPU- and GPU-bound Scenarios
Before we go deeper, here’s a recap of the basics of CPU-bound and GPU-bound scenarios. The CPU always does the main work when an application runs and is built to handle branching and complexity, juggling multiple tasks. The GPU, on the other hand, is designed to process small, bite-sized tasks very efficiently. The CPU sends rendering instructions to the GPU, gift-wrapped for easy computation, and keeps the pipeline moving as frame after frame processes and returns.
In a bound scenario, either the CPU or the GPU is idle or completely maxed out. Sometimes the CPU generates rendering instructions so fast that it sits idle, waiting for the GPU to finish up and ask for more. In this case, the GPU is bounding the system. The frame rate cannot improve until the GPU can keep up with the CPU. Jacques van Rhyn explains this in more detail in a Microsoft* devblog.
In other cases, the CPU is unable to keep up with the GPU. Instructions can’t come fast enough to keep the GPU busy, and it waits for something to do. In this case, the CPU is bounding the system. The frame rate cannot improve until the CPU does a better job of keeping up with the GPU.
There are many variables to consider, but here are some of the likely causes:
Hardware imbalance
A new, latest-generation CPU can out-perform an older discrete graphics card. Likewise, an older-generation CPU will not keep up with a new, high-end GPU. Hardware systems need balance to perform at peak levels, and games need to optimize for multiple hardware levels as they target the widest possible audience.
Game performance
Expansive, open-world titles with a real-time strategy component put enormous burdens on a CPU, requiring balance between assets and functionality such as AI, enemy combatants, and backgrounds. Alternately, a lush, elaborate environment with detailed, immersive artwork may require far more resources than the GPU can ever muster smoothly.
Settings
Game settings may be set higher than they need to be. Lowering resolution can free up GPU resources while reducing the settings for draw distances can boost CPU performance.
Scene characteristics
Scenes can vary widely even within a game, with the system becoming alternately CPU-bound or GPU-bound.
Intel GPA can assist with identifying these common bottlenecks – so you can find out what your application is struggling with and where the troublesome hotspots are – and help you solve these problems.
Capture a Trace
The first step in taking a closer look at CPU-GPU performance is to set up Intel GPA to capture a trace. Use Graphics Monitor to configure and capture a trace for subsequent analysis. To set the system up, configure your trace settings in the Trace tab under Options in Graphics Monitor. When you’re ready to start a trace capture, use the CTRL+SHIFT+T keyboard shortcut. The essentials are straightforward; for more information on how to capture a trace, refer to this video, Graphics Trace Analyzer Deep Dive | Part 1 | Configure and Capture a Trace.

Identify CPU and GPU Bottlenecks with Intel® GPA
Once you capture a trace, you can begin a detailed exploration of your capture file. Trace files have an enormous amount of data. You can enable or disable data and reorganize or recolor the timeline tracks in order to more easily view what is relevant to your use case at the moment. Also, you can select calls or regions to see detailed information. See this video to learn about these features, Graphics Trace Analyzer Deep Dive | Part 2 | Open and Explore.

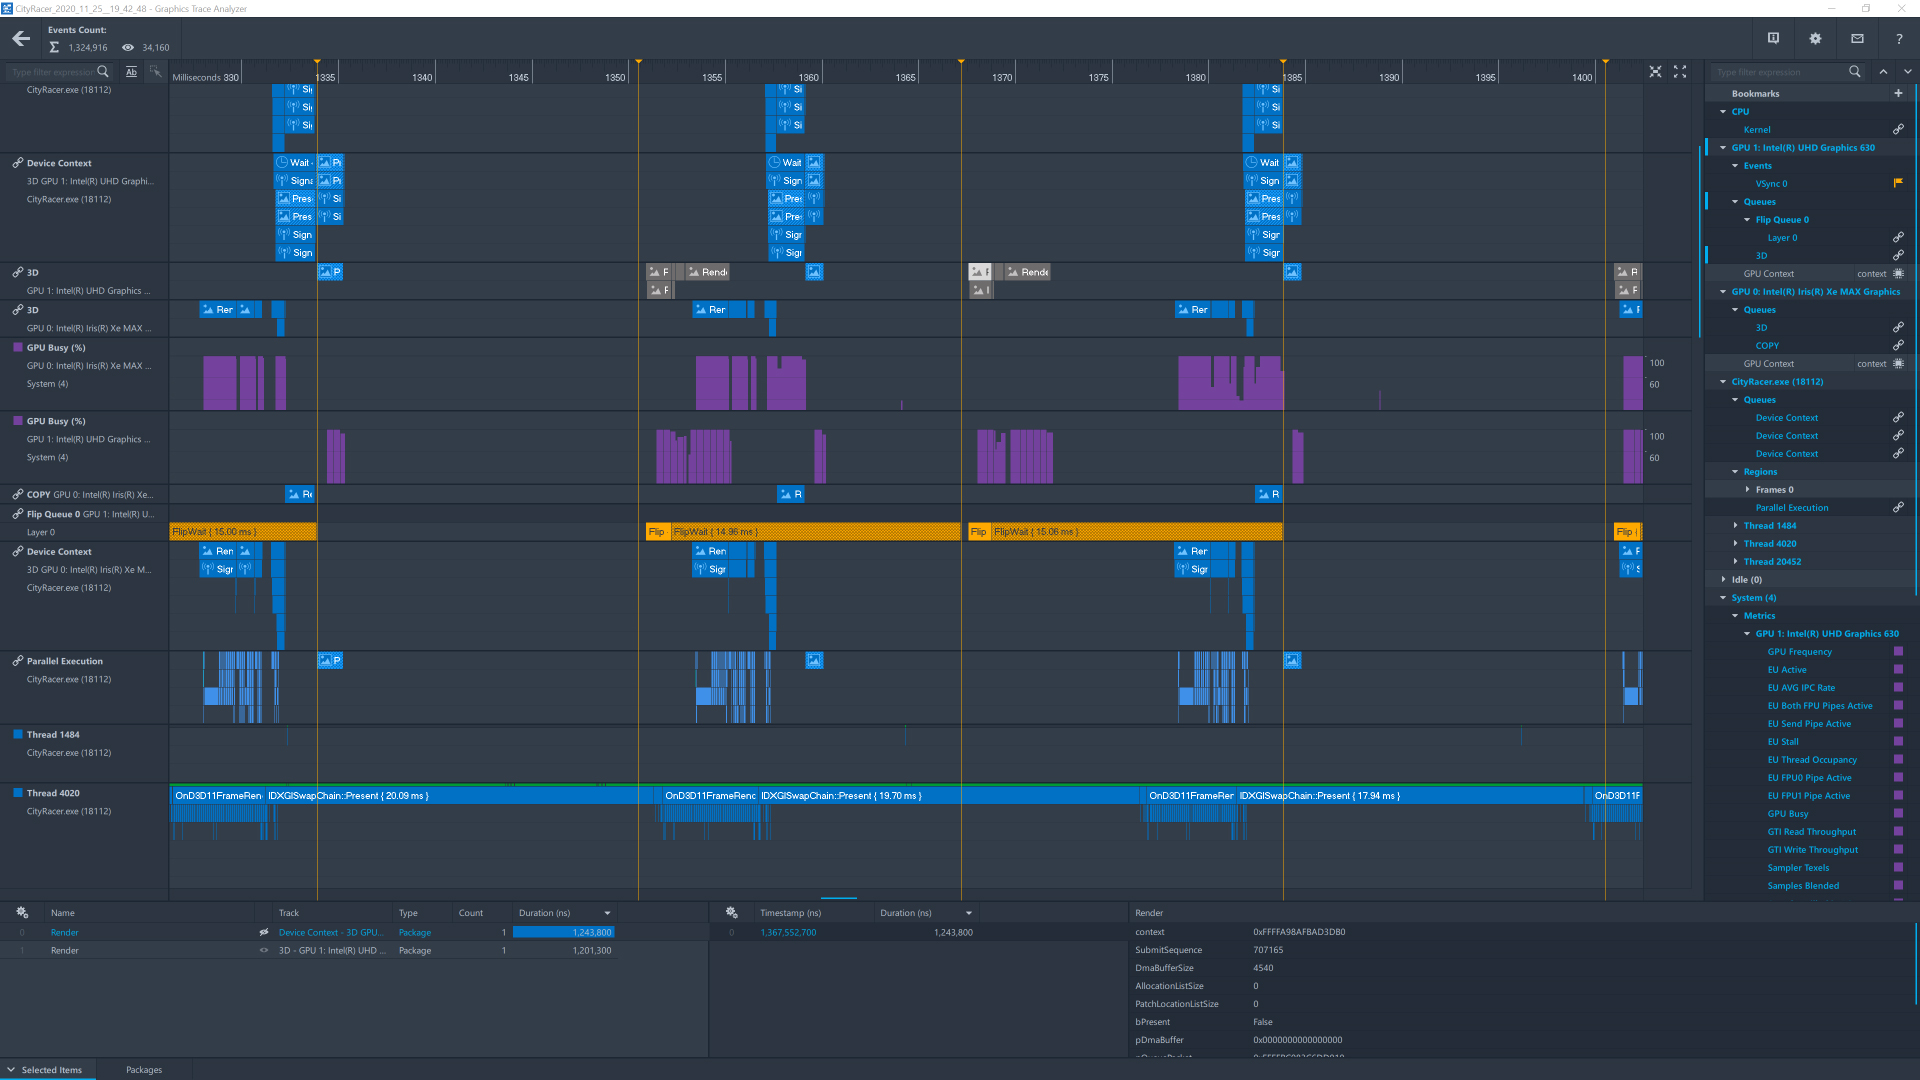
To start analysis, launch Trace Analyzer and select the captured trace file. Once it loads, you can see a timeline showing a large amount of data, as shown in Figure 2.
There are five main sections of analysis:
- Under Kernel, located below the Trace name, you’ll find the CPU context queue. It shows the various CPU cores.
- Under Metrics, next down, you’ll find the captured metrics, showing GPU percent busy, the frame rate, and target CPU load, among other data.
- Under GPU Nodes you can view the GPU Adapter queue. This shows the load on the GPU.
- Under CPU Frame you’ll see the thread and API calls.
- Under the Paging queue, you’ll see CPU submissions and the status of its queue.
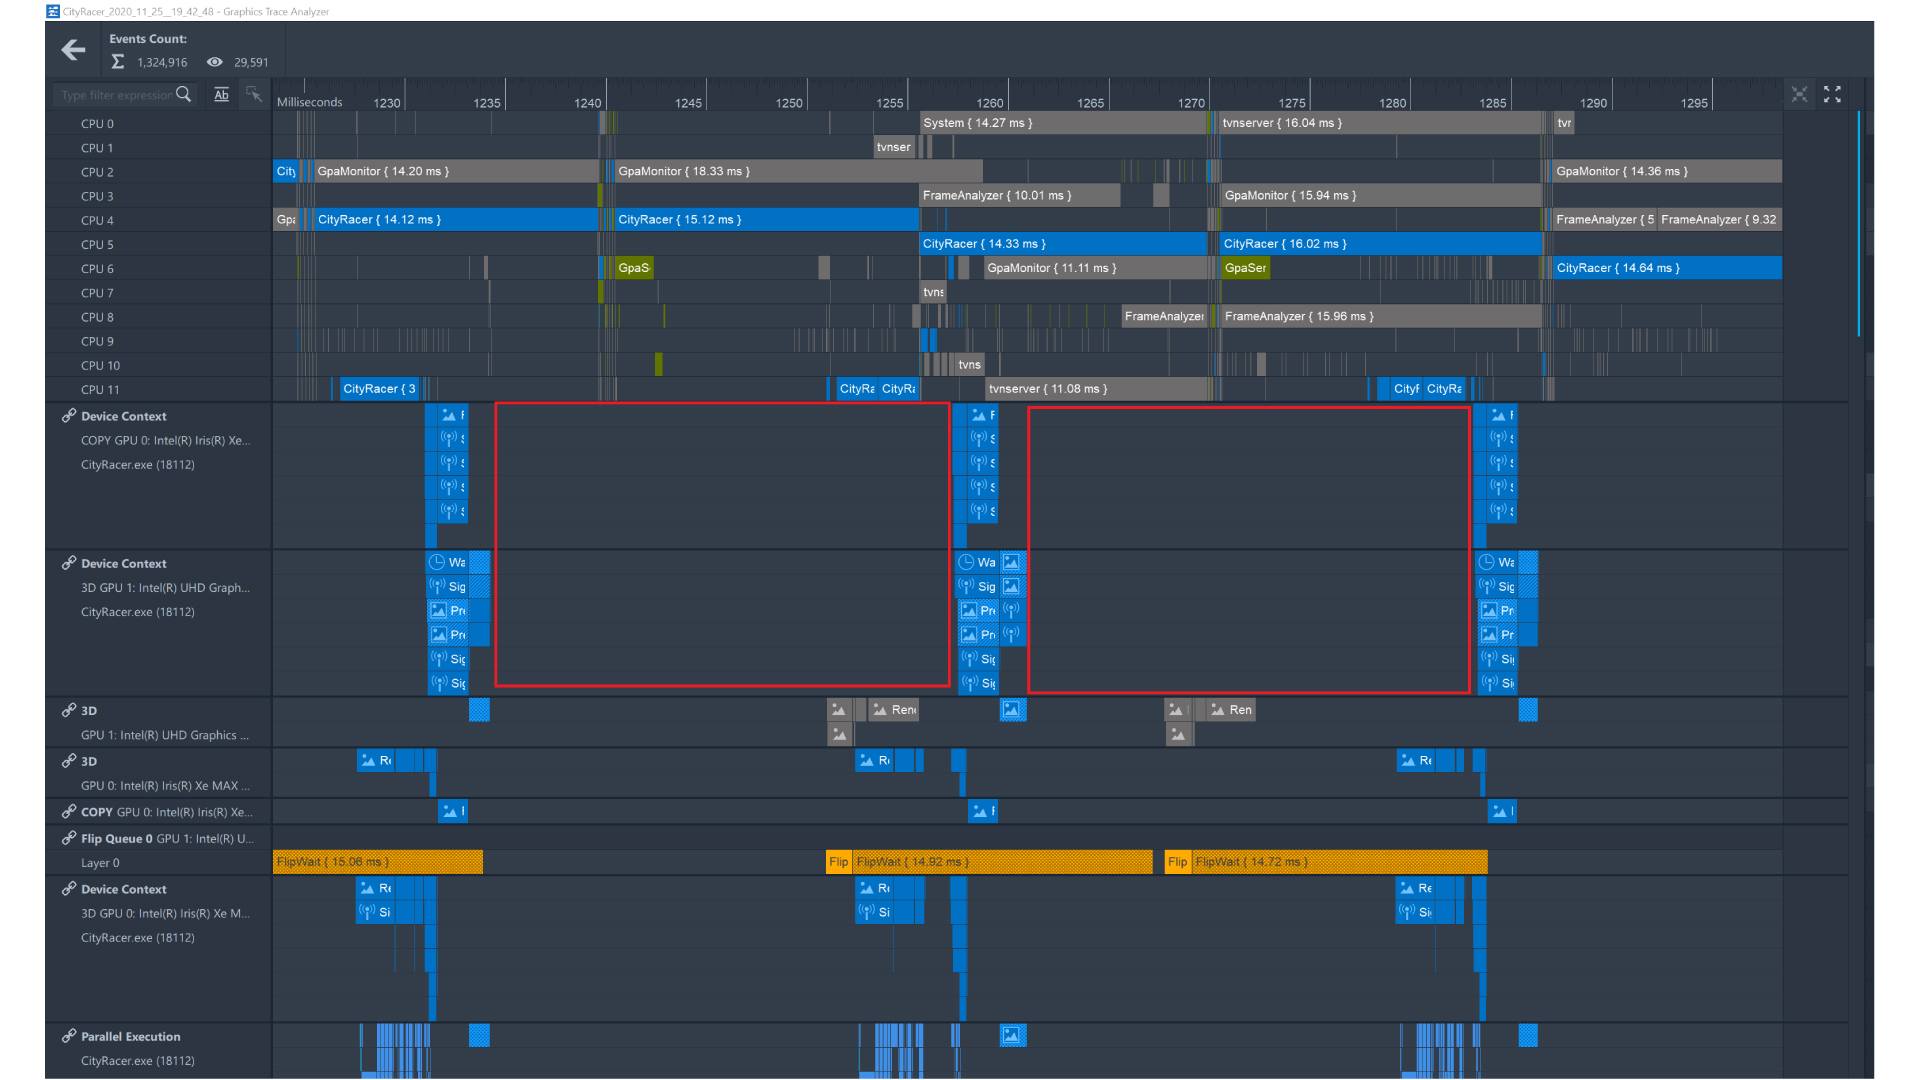
You can use the hot keys W-A-S-D to expand or contract the data in a queue. To determine bounding status, look for gaps in one sector while the other is maxed out. In Figure 3, you can see gapping in the GPU engine, designated by black circles under yellow arrows. The CPU is at maximum capacity in this scenario, but the GPU is idle, indicating that the system is CPU-bound.

For an overview of analyzing CPU and GPU bottlenecks, refer to videos here.
Address CPU Bottlenecks
If your application is CPU-bound, you can review trace data captured during the application run to perform in-depth analysis with respect to the CPU and GPU activity distribution. Intel GPA collects real-time trace data during the application run and provides information on the code execution on the various CPU and GPU cores in your system. You can analyze some CPU-based workloads together with GPU-based workloads within a unified time domain.
The closer the average CPU utilization is to 100%, the more likely it is you have an unbalanced CPU load. Use the Null Driver test to determine if the frame rate increases when the graphics driver is removed – this proves your game is CPU-bound. CPU bottlenecks can be addressed using optimizations built into the compiler and implementing parallelism via multithreading. Intel's optimization compilers are available from the Intel® C++ Compiler Professional Edition and from Intel® Parallel Studio products. Intel® Threading Building Blocks (Intel® TBB) includes a library that offers a rich and complete approach to expressing parallelism in a C++ program. This means you can take advantage of multicore processor performance without having to be a threading expert. OpenMP* threading technology is also fully supported by the compilers.
For advanced topics and more detail about identifying and resolving bottlenecks, refer to this article on Practical Game Performance Analysis.
Resolve GPU Bottlenecks
While Graphics Trace Analyzer allows you to visualize captured data over a segment of runtime, Graphics Frame Analyzer lets you visualize and analyze multiframe streams to identify single frames of interest and profile them down to draw-call level. The more powerful GPUs become, the more resource-demanding graphics they can create. Game-makers try to use all available advantages of modern GPUs and therefore often face graphics performance issues.
If your game’s frames per second (FPS) drops below a desired level you must identify bottlenecks in the software or hardware that limit the game’s performance. Slow speeds are not always a result of bottlenecks in the GPU part of a game. A slow or limited CPU can also impact graphics performance, so be sure to first check Graphics Trace Analyzer, as explained above.
In Figure 4, in Graphics Frame Analyzer's visualiztion of the collected frame data, you can see the affect of the selected draw on the render target within the resource. The bar chart along the top of Graphics Frame Analyzer defaults to GPU duration on both the X and Y axes so that you can find the most expensive draw call by biggest rectangle area, but you can adjust the axis settings. You can see packets at work on the CPU and GPU. Click on one of the large rectangles in the bar chart to bring up the details around that expensive draw call to analyze potential optimization opportunities.
Notice the Metrics pane in Graphics Frame Analyzer. It is a key tool to use when searching for and resolving GPU bottlenecks. The Metrics pane has a 3D pipeline, current selection, and full frame view that shows primary (red) bottlenecks and secondary (orange) bottlenecks. You can experiment with state overrides to identify potential fixes. Figure 4 shows the location of the Metrics pane, on the right of the screen. And Figure 5 shows a closeup of the pane.


To switch between different views, click the corresponding tab on the Metrics pane. The 3D Pipeline tab groups all metrics by specific hardware blocks that are used for geometry rendering. The Compute Pipeline tab groups all metrics by specific hardware blocks that are used for computing processes. Selecting a primary bottleneck in either the 3D Pipeline or Compute Pipeline tabs will display information on how to resolve that bottleneck. In Figure 5, the user selected the Sampler under the 3D Pipeline tab and received a warning indicating that the Sampler is a bottleneck, along with suggestions to adjust the sampling access pattern, filtering mode, surface type/format, and the number of sampled surfaces. More information is also available for further exploration.
In another example, you might get an error condition where the primary bottleneck is in the geometry transformation stages. To resolve the issue, you could optimize your shaders, reduce the number of off-screen polygons generated from shading, and reduce unnecessary state changes between draws. Of course, this may be easy to say and complex to accomplish, but these are three areas where you can begin experimenting.
You can adjust texture bandwidth, optimize complex geometry, modify render states, or edit shaders – all without recompiling your application or modifying source code. You can also use Pixel History to minimize overdraw, use Resource History to view resource dependency, or Hotspot Mode to identify expensive draw calls based on pipeline bottlenecks, state, and GPU duration.
For more information about the Metrics Pane refer to the article Pane: Metrics.
Get Started Today
This article has explored the basics of identifying and resolving CPU-GPU bottlenecks. You can download and start to experiment with Intel GPA right away. Optimizing your title to work efficiently across CPUs and graphics chipsets – whether discrete or embedded – ensures that you hit all key target markets. Game devs can’t afford to put off optimizing the load between the CPU and the GPU; investigating and solving bottlenecks throughout the process is crucial. Use Intel GPA early and often to pinpoint heavy loads at system and frame level. You can make profiling and frame-rate analysis an early part of your QA effort, which will ensure a smoother rollout when the time comes, saving yourself potential headaches long before you release to your waiting audience.
Resources
Intel® Developer Zone
Intel GPA download page
CPU vs. GPU: Making the Most of Both
CPU-Bound Offline Analysis
Trace Analysis for CPU-Bound Applications Training Video
Frame Analysis for GPU-Bound Applications Training Video
How to Fix Performance Woes (GDC 2019 Video)
Intel GPA Cookbook