Overview
Persistent memory is an emerging class of memory storage technology with great potential to improve application performance and reliability. However, developers will need to address several programming challenges to get the best performing code. One challenge is that a store to persistent memory does not become persistent immediately due to caching. The data persists only after it is out of the cache hierarchy and is visible to the memory system. And because of processor out-of-order execution and caching, the order of persistence may not be the same as the order of store.
Intel® Inspector - Persistence Inspector, is currently available as pat of Intel® Parallel Studio XE , is a new run-time tool developers can use to detect these programming errors in persistent memory programs. In addition to cache flush misses, this tool detects
- Redundant cache flushes and memory fences
- Out-of-order persistent memory stores
- Incorrect undo logging for the Persistent Memory Development Kit (PMDK)
This article describes the features of Intel Inspector - Persistence Inspector and includes information to help you get started using it.
Background
Persistent memory devices using new technologies such as Intel® Optane™ DC media developed by Intel and Micron* can be directly attached to memory controllers. Such a device is often referred to as a non-volatile dual in-line memory module (NVDIMM). Data in NVDIMMs is byte-addressable and can survive system or program crashes. The access latencies of NVDIMMs are comparable to those of DRAMs. Programs read from and write to NVDIMMs using regular CPU load/store instructions. Consider the following code example:
Example 1: Write an Address Book to Persistent Memory
#include <stdio.h>
#include <fcntl.h>
#include <sys/file.h>
#include <sys/mman.h>
#include <string.h>

struct address {
	char name[64];
	char address[64];
	int valid;
}

int main()
{
	struct address *head = NULL;
	int fd;
	fd = open("addressbook.pmem", O_CREAT|O_RDWR, 0666);
	posix_fallocate(fd, 0, sizeof(struct address));

	head = (struct address *)mmap(NULL, sizeof(struct address), PROT_READ|PROT_WRITE,    MAP_SHARED, fd, 0);
    close(fd);

    strcpy(head->name, "Clark Kent");
	strcpy(head->address, "344 Clinton St, Metropolis, DC 95308");
	head->valid = 1;

    munmap(head, sizeof(struct address));

	return 0;
}
In example 1, persistent memory is exposed as the file addressbook.pmem and mapped into the process address space using regular file system APIs. Once the persistent memory is mapped in, the program then directly accesses the memory starting with the calls to strcpy. If there is power loss before the call to munmap, one of the following scenarios can take place in the persistent memory:
- None of
head->name,head->address, andhead->validhas made its way to the memory system and become persistent. - All of them have become persistent.
- Any one or two of them, but not all, have become persistent.
The caching effect presents a challenge to persistent memory software development. To guarantee data is recoverable and consistent after a power failure or system crash, developers need to reason where and when to explicitly flush data out of cache hierarchy to the memory system.
Persistent Memory Application Behavior
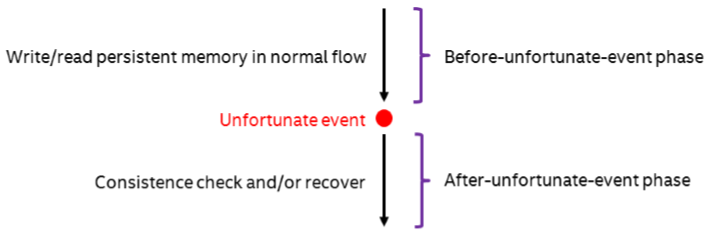
Upon restarting after an unfortunate event such as a power failure or system crash, persistent memory applications must validate consistency and perform recovery of data stored in the memory. Typically, an unfortunate event can divide a persistent memory application into two phases: one that executes before the unfortunate event and one that executes after the unfortunate event. This can potentially cause data corruption or inconsistency. In the before-unfortunate-event phase, the application runs its normal flow reading from and writing to the persistent memory. The after-unfortunate-event phase checks data consistency and recovers inconsistent data to consistency states before the application resumes normal operations.
How to use Intel Inspector - Persistence Inspector
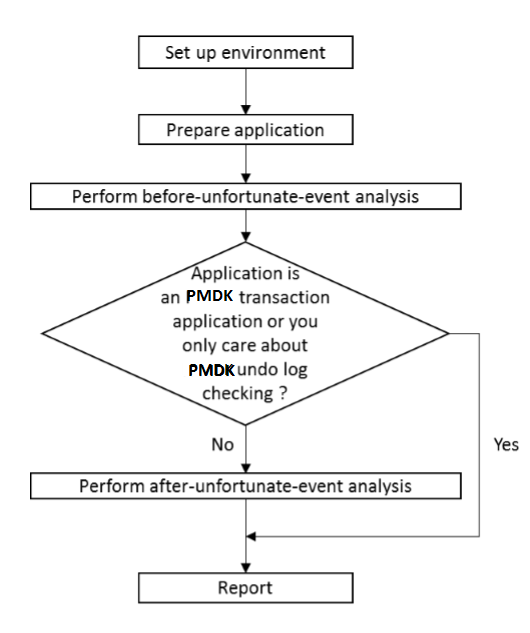
Here is the usage workflow of Intel Inspector - Persistence Inspector:
Setting Up the Environment
After the tool files are installed in a directory of choice, for example, /home/joe/pmeminsp, add the Intel Inspector - Persistence Inspector path to PATH and LD_LIBRARY_PATH environment variables. For example:
$ export PATH=/home/joe/pmeminsp/bin64:$PATH
$ export LD_LIBRARY_PATH=/home/joe/pmeminsp/lib64:$LD_LIBRARY_PATH
To verify the tool is installed and set up correctly, you can type in “pmeminsp”.
$ pmeminsp Type 'pmeminsp help' for usage.
Preparing Your Application
As stated earlier, a persistent memory application typically consists of two phases. To use Intel Inspector -Persistence Inspector, you need to identify code in these two phases.
- Before-unfortunate-event phase. Executes the code you want the tool to check.
- After-unfortunate-event phase. Executes the code you would run after a power failure or system crash.
If your application implements persistent memory support for transactions using the Persistent Memory Developer Kit (PMDK), the PMDK transaction runtime support is responsible for data consistency and recovery inside the transaction block. The after-unfortunate-event code resides in the PMDK transaction runtime. Therefore there is no need to use Intel Inspector - Persistence Inspector for verification of that particular phase.
Notifying Intel® Inspector - Persistence Inspector of An After-Unfortunate-Event phase
Once the after-unfortunate-event phase is identified, to significantly reduce analysis time, we highly recommend you notify the tool of exactly where the after-unfortunate-event phase starts and stops. Intel Inspector - Persistence Inspector provides a set of APIs for the application to notify the tool at runtime of the start and stop of the after-unfortunate-event phase analysis.
#define PMEMINSP_PHASE_AFTER_UNFORTUNATE_EVENT 0x2 void __pmeminsp_start(unsigned int phase); void __pmeminsp_pause(unsigned int phase); void __pmeminsp_resume(unsigned int phase); void __pmeminsp_stop(unsigned int phase);To notify the tool of the start of the after-unfortunate-event phase, all you need is a call to __pmeminsp_start (PMEMINSP_PHASE_AFTER_UNFORTUNATE_EVENT) right before the after-unfortunate-event phase starts in your application. Similarly, to notify the tool of the stop of the after-unfortunate-event phase, all you need is a call to __pmeminsp_stop(PMEMINSP_PHASE_AFTER_UNFORTUNATE_EVENT) right after the after-unfortunate-event phase ends in your application.
The __pmeminsp_pause(PMEMINSP_PHASE_AFTER_UNFORTUNATE_EVENT) and __pmeminsp_resume (PMEMINSP_PHASE_AFTER_UNFORTUNATE_EVENT) calls give you finer control over pausing and resuming analysis after the analysis is started and before it is stopped.
For example, if the after-unfortunate-event phase is the duration of function recover() call, you can simply place __pmeminsp_start(PMEMINSP_PHASE_AFTER_UNFORTUNATE_ EVENT) at the entry of the function and __pmeminsp_stop(PMEMINSP_PHASE_AFTER_ UNFORTUNATE_EVENT) at the exit of the function.
Example 2: Notify Intel Inspector - Persistence Inspector of the Start and Stop of the After-Unfortunate-Event Phase.
#include “pmeminsp.h”

 …

 … …

void recover(void)
{
    __pmeminsp_start(PMEMINSP_PHASE_AFTER_UNFORTUNATE_EVENT);

    …

    __pmeminsp_stop((PMEMINSP_PHASE_AFTER_UNFORTUNATE_EVENT);
}

void main()
{

    …

    … = mmap(…..);

    __pmeminsp_stop((PMEMINSP_PHASE_AFTER_UNFORTUNATE_EVENT);

    …
    recover();
}
The Intel Inspector - Persistence Inspector APIs are defined in libpmeminsp.so. When you build your applications, make sure to specify the correct options. For example,
-I /home/joe/pmeminsp/include –L /home/joe/pmeminsp/lib64 –lpmeminsp.
Analyzing the Before-Unfortunate-Event Phase
The command to run the before-unfortunate-event analysis phase is
pmeminsp check-before-unfortunate-event [options] --
If your application maps the persistent memory file directly using the system API, you also need to specify the path to that file (even if it doesn't exist before application run) using option -pmem-file. For example:
pmeminsp check-before-unfortunate-event -pmem-file ./addressbook.pmem [options] --
If the application creates several files, it should be possible to specify the path to the folder with such files. Any file mmap'ed from that location will be interpreted as a persistent memory file.
Note that these two options are redundant if your application is PMDK-based. Intel Inspector - Persistence Inspector automatically traces all persistent memory files managed by PMDK even if these options are absent.
Analyzing the After-Unfortunate-Event Phase
The command to run the after-unfortunate-event analysis phase is
pmeminsp check-after-unfortunate-event [options] --
Make sure that the location of the persistent memory file is specified unless your application uses PMDK to operate with persistent memory. Option names are similar to those of the check-before-unfortunate-event command.
Reporting Issues Detected
To generate a report of persistent memory issues detected, run
pmeminsp report [option] --
Here are some examples of diagnostics generated by Intel Inspector - Persistent Inspector:
Missing Cache Flush
A missing cache flush of a persistent memory store (first store) is always with reference to a later persistent memory store (second store). Its potential adverse effect is that the second store is made persistent but the first store is not if an unfortunate event occurs after the second store.
The first memory store,
in /home/joe/pmeminsp/addressbook/writeaddressbook!main at writeaddressbook.c:24 - 0x6ED, in /lib/x86_64-linux-gnu/libc.so.6!__libc_start_main, at: - 0x21F43 in /home/joe/pmeminsp/addressbook/writeaddressbook!_start at: - 0x594
is not flushed before the second memory store,
in /home/joe/pmeminsp/addressbook/writeaddressbook!main at: writeaddressbook.c:26 - 0x73F, in /lib/x86_64-linux-gnu/libc.so.6!__libc_start_main, at: - 0x21F43, in /home/joe/pmeminsp/addressbook/writeaddressbook!_start at: - 0x594
While, the memory load from the location of the first store,
in /lib/x86_64-linux-gnu/libc.so.6!strlen at: - 0x889DAdepends on the memory load from the location of the second store,
in /home/joe/pmeminsp/addressbook/readaddressbook!main at readaddressbook.c:22 - 0x6B0Redundant or Unnecessary Cache Flushes
A redundant or unnecessary cache flush is one that can be removed from the analyzed execution path without affecting the correctness of the program. Though a redundant or unnecessary cache flush does not affect the program correctness, it can potentially affect the program performance.
Cache flush
in /home/joe/pmeminsp/tests/pmemdemo/src/pemmdemo!test_redundant_flush at main.cpp:134 - 0x1721, in /home/joe/pmeminsp/tests/pmemdemo/src/pemmdemo!create_data_file at main.cpp:52 - 0x151F,in /home/joe/pmeminsp/tests/pmemdemo/src/pemmdemo!create_data_file at main.cpp:48 - 0x14FD,in /home/joe/pmeminsp//tests/pmemdemo/src/pemmdemo!main at main.cpp:231 - 0x1C74,in /lib/x86_64-linux-gnu/libc.so.6!__libc_start_main, at: - 0x21F43,in /home/joe/pmeminsp/tests/pmemdemo/src/pemmdemo!_start at: - 0x12A4is redundant with regard to cache flush
in /home/joe/pmeminsp/tests/pmemdemo/src/pemmdemo!test_redundant_flush at main.cpp:135 - 0x1732,in /home/joe/pmeminsp/tests/pmemdemo/src/pemmdemo!create_data_file at main.cpp:52 - 0x151F,in /home/joe/pmeminsp/tests/pmemdemo/src/pemmdemo!create_data_file at main.cpp:48 - 0x14FD,in /home/joe/pmeminsp/tests/pmemdemo/src/pemmdemo!main at main.cpp:231 - 0x1C7,in /lib/x86_64-linux-gnu/libc.so.6!__libc_start_main at: - 0x21F43,in /home/joe/pmeminsp/tests/pmemdemo/src/pemmdemo!_start at: - 0x12A4of the memory store
in /home/joe/pmeminsp/tests/pmemdemo/src/pemmdemo!test_redundant_flush at main.cpp:133 - 0x170F,in /home/joe/pmeminsp/tests/pmemdemo/src/pemmdemo!create_data_file at main.cpp:52 - 0x151F,in /home/joe/pmeminsp/tests/pmemdemo/src/pemmdemo!create_data_file at main.cpp:48 - 0x14FD,in /home/joe/pmeminsp/tests/pmemdemo/src/pemmdemo!main at main.cpp:231 - 0x1C74,in /lib/x86_64-linux-gnu/libc.so.6!__libc_start_main at: - 0x21F43,in /home/joe/pmeminsp/tests/pmemdemo/src/pemmdemo!_start at: - 0x12A4Out-of-Order Persistent Memory Stores
Out-of-order persistent memory stores are two stores whose correct persistence order cannot be enforced. It is also worth pointing out that explicit cache flushes will not enforce a correct order.
Out-of-order persistent memory stores could be enabled by -check-out-of-order-store option in 'report' command.
The memory store
in /home/joe/pmemcheck/mytest/writename6!writename at writename6.c:13 - 0x6E0, in /home/joe/pmemcheck/mytest/writename6!main at writename6.c:21 - 0x72D, in /home/joe/pmemcheck/mytest/writename6!main at writename6.c:20 - 0x721, in /lib/x86_64-linux-gnu/libc.so.6!__libc_start_main at: - 0x21F43,in /home/joe/pmemcheck/mytest/writename6!_start at: - 0x594should be after the memory store
in /home/joe/pmemcheck/mytest/writename6!writename at writename6.c:14 - 0x6EB,in /home/joe/pmemcheck/mytest/writename6!main at writename6.c:21 - 0x72D,in /home/joe/pmemcheck/mytest/writename6!main at writename6.c:20 - 0x721, in /lib/x86_64-linux-gnu/libc.so.6!__libc_start_main at: - 0x21F43,in /home/joe/pmemcheck/mytest/writename6!_start at: - 0x594Update Without Undo Logging
It is the developer's responsibility to undo log a memory location before it is updated in a PMDK transaction. Usually, developers call PMDK function pmemobj_tx_add_range() or pmemobj_tx_add_range_direct(), or use macro TX_ADD() to undo log a memory location. If the memory location is not undo logged before it is updated, PMDK will fail to rollback changes to the memory location if the transaction is not successfully committed.
An issue of update without undo logging is reported with reference to a memory store and a transaction in which the memory is updated.
Memory store
in /home/joe/pmeminsp/tests/pmemdemo/src/pemmdemo!test_tx_without_undo at main.cpp:190 - 0x1963,in /home/joe/pmeminsp/tests/pmemdemo/src/pemmdemo!run_tx_test at main.cpp:175 - 0x1877,in /home/joe/pmeminsp/tests/pmemdemo/src/pemmdemo!run_tx_test at main.cpp:163 - 0x180D,in /home/joe/pmeminsp/tests/pmemdemo/src/pemmdemo!main at main.cpp:245 - 0x1CF4,in /lib/x86_64-linux-gnu/libc.so.6!__libc_start_main at: - 0x21F43,in /home/joe/pmeminsp/tests/pmemdemo/src/pemmdemo!_start at: - 0x12A4not undo logged in transaction
in /home/joe/pmeminsp/tests/pmemdemo/src/pemmdemo!test_tx_without_undo at main.cpp:185 - 0x1921,in /home/joe/pmeminsp/tests/pmemdemo/src/pemmdemo!run_tx_test at main.cpp:175 - 0x1877,in /home/joe/pmeminsp/tests/pmemdemo/src/pemmdemo!run_tx_test at main.cpp:163 - 0x180D,in /home/joe/pmeminsp/tests/pmemdemo/src/pemmdemo!main at main.cpp:245 - 0x1CF4,in /lib/x86_64-linux-gnu/libc.so.6!__libc_start_main at: - 0x21F43, in /home/joe/pmeminsp/tests/pmemdemo/src/pemmdemo!_start at: - 0x12Undo Log Without Update
It is the developer's responsibility to undo log a memory location before it is updated in a PMDK transaction. Usually, developers call PMDK function pmemobj_tx_add_range() or pmemobj_tx_add_range_direct(), or use macro TX_ADD() to undo log a memory location. If the memory location is undo logged but it is never updated inside a PMDK transaction, performance may be degraded and/or the memory may be rolled back back to a dirty/uncommitted/stale value if the transaction is not successfully committed.
An issue of undo log without update is reported with the reference to a PMDK undo logging call and a transaction in which the memory is undo logged.
Memory region is undo logged in /home/joe/pmeminsp/tests/pmemdemo/src/pemmdemo!test_tx_without_update at main.cpp:190 - 0x1963, in /home/joe/pmeminsp/tests/pmemdemo/src/pemmdemo!run_tx_test at main.cpp:175 - 0x1877, in /home/joe/pmeminsp/tests/pmemdemo/src/pemmdemo!run_tx_test at main.cpp:163 - 0x180D, in /home/joe/pmeminsp/tests/pmemdemo/src/pemmdemo!main at main.cpp:245 - 0x1CF4, in /lib/x86_64-linux-gnu/libc.so.6!__libc_start_main at: - 0x21F43, in /home/joe/pmeminsp/tests/pmemdemo/src/pemmdemo!_start at: - 0x12A4but is not updated in transaction
in /home/joe/pmeminsp/tests/pmemdemo/src/pemmdemo! test_tx_without_update at main.cpp:185 - 0x1921, in /home/joe/pmeminsp/tests/pmemdemo/src/pemmdemo!run_tx_test at main.cpp:175 - 0x1877, in /home/joe/pmeminsp/tests/pmemdemo/src/pemmdemo!run_tx_test at main.cpp:163 - 0x180D, in /home/joe/pmeminsp/tests/pmemdemo/src/pemmdemo!main at main.cpp:245 - 0x1CF4, in /lib/x86_64-linux-gnu/libc.so.6!__libc_start_main at: - 0x21F43, in /home/joe/pmeminsp/tests/pmemdemo/src/pemmdemo!_start at: - 0x12A4.Conclusion
Persistent memory is an exciting new technology. As we discussed in this article, this technology presents some programming challenges. These challenges can be mitigated using tools like Intel Inspector - Persistence Inspector, which allow you to discover issues earlier in the program life cycle and have a very high return on investment.
Next Steps
To start using Intel® Inspector - Persistence Inspector, get a copy of Intel® Parallel Studio XE and start checking your Persistent workloads today.
"