Abstract
This paper illustrates best-known methods and performance optimizations used in the Data Plane Development Kit (DPDK). DPDK application developers will benefit by implementing these optimization guidelines in their applications. A problem well stated is a problem half-solved, thus the paper starts with profiling methodology to help identify the bottleneck in an application. Once the type of bottleneck is identified, this paper will help developers determine the optimization mechanism that DPDK uses to overcome such bottleneck. Specifically, the paper refers to the respective sample example application and code snippet that implements corresponding performance optimization technique. The paper concludes with a checklist flowchart that DPDK developers and users can use to ensure they follow the guidelines given here.
For cookbook-style instructions on how to do hands-on performance profiling of your DPDK code with VTune, refer to the companion article Profiling DPDK Code with Intel® VTune™ Amplifier.
About The Author

M Jay has worked with the DPDK team from 2009 onwards. M Jay joined Intel in 1991 and has been in various roles and divisions with Intel – 64 bit CPU front side bus architect, 64 bit HAL developer to mention a few before DPDK team. M Jay holds 21 US Patents, both individually and jointly, all issued while working in Intel. M Jay was awarded the Intel Achievement Award in 2016, Intel's highest honor based on innovation and results. Please send your feedback to M Jay at Muthurajan.Jayakumar@intel.com
The Strategy and Methodology
A chain is really only as strong as its weakest link. So the strategy is to use profiling tools to identify the hotspot in the system. Once the hotspot is identified, the corresponding optimization technique is looked up for the sample application and code snippet as how it is already solved and implemented in the DPDK. Developers at this stage will implement those specific optimization techniques in their application. They can run respective micro-benchmarks and unit tests on applications provided with the DPDK.
Once the particular hotspot has been addressed, the application is again profiled to find the current hotspot in the system. The above methodology is repeated to the point of satisfaction in terms of achieving desired performance.
The performance optimization involves a gamut of considerations shown in the checklist below:
- Optimize the BIOS settings.
- Efficiently partition NUMA resources with improved locality in mind.
- Optimize the Linux* configuration.
- To validate the above setup, run L3-fwd—as is with default settings—and compare with published performance numbers.
- Run micro-benchmarks to pick and choose optimum high-performance components (for example, bulk enqueue/bulk dequeue as opposed to single enqueue/single dequeue).
- Pick a sample application that is similar to the target appliance, using the already fine-tuned optimum default settings (for example, more TX buffer resources than Rx).
- Adapt and update the sample application (for example, # of queues). Compile with the correct level of optimization flags.
- Profile the chosen sample application in order to have a known good comparison base.
- Run with optimized command-line options, keeping improved locality and concurrency in mind.
- How to best match application and algorithm to underlying architecture? Run profiling to find memory bound? I/O bound? CPU bound?
- Apply the corresponding solution: Software prefetch for memory, block mode for I/O, to hyperthread or not to hyperthread for CPU bound.
- Rerun profiling – Front-end pipeline stall? Back-end pipeline stall?
- Apply corresponding solution. Write efficient code—branch prediction, Loop unroll, compiler optimization, and so on.
Still don't have desired performance? (back to #9)
- Record best-known methods and share in dpdk.org.
Recommended Pre-reading
It is recommended that you read, at a minimum, the DPDK Programmer’s Guide, and refer to the DPDK Sample Application User Guide before proceeding.
Please refer to other DPDK documents as needed.
BIOS Settings
DPDK L3fwd performance numbers are achieved with the following BIOS settings. To get repeatable performance, use the following settings.
| NUMA | ENABLED |
| Enhanced Intel® SpeedStep® technology | DISABLED |
| Processor C3 | DISABLED |
| Processor C6 | DISABLED |
| Hyper-Threading | ENABLED |
| Intel® Virtualization Technology for Directed I/O | DISABLED |
| MLC Streamer | ENABLED |
| MLC Spatial Prefetcher | ENABLED |
| DCU Data Prefetcher | ENABLED |
| DCU Instruction Prefetcher | ENABLED |
| CPU Power and Performance Policy | Performance |
| Memory Power Optimization | Performance Optimized |
| Memory RAS and Performance Configuration -> NUMA Optimized | ENABLED |
Please note that if the DPDK power management feature is to be used, Enhanced Intel® SpeedStep® technology must be enabled. In addition, C3 and C6 should be enabled.
However, to start with, it is recommended that you use the BIOS settings as shown in the table and run basic L3fwd to ensure that the BIOS, platform, and Linux* settings are optimal for performance.
Refer to Intel Document # 557159 titled Intel® Xeon® processor E7-8800/4800 v3 Product Family (code-name Haswell-ex) Performance Tuning Guide for detailed understanding of BIOS setting and performance implications.
Platform Optimizations
Platform optimizations include (1) configuring memory and (2) I/O (NIC Cards) to take advantage of affinity to achieve lower latency.
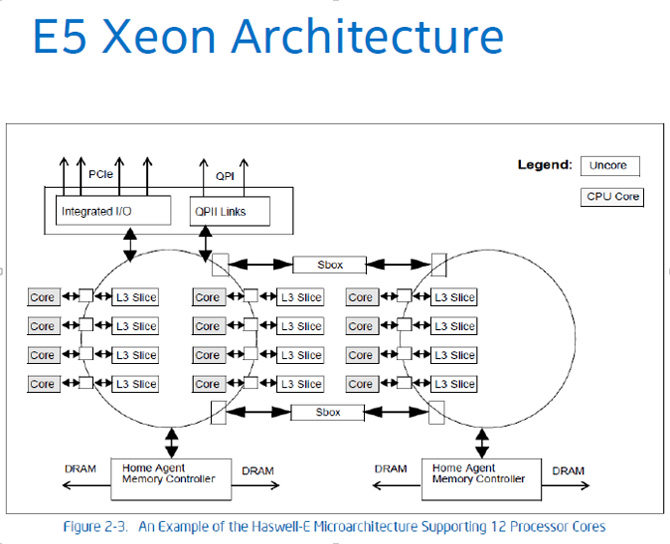
Platform Optimizations – NUMA & Memory Controller
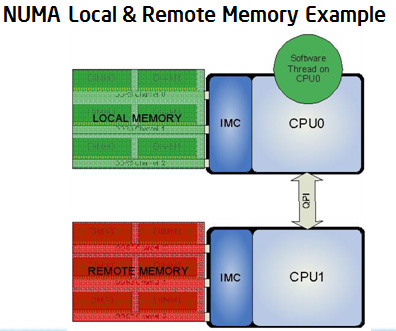
Below is an example of a multi (dual) socket system. For the threads that runs on CPU0, all the memory accesses going to memory local to socket 0 results in lower latency. Any accesses that cross Intel® QuickPath Interconnect (QPI ) to access remote memory (that is, memory local to socket 1) incurs additional latency and should be avoided.
Problem:
What happens when in BIOS NUMA is set to DISABLED? When NUMA is disabled in the BIOS, the memory controller interleaves the accesses across the sockets.
For example, as shown below, CPU0 is reading 256 bytes (4 cache lines). With BIOS NUMA Setting in the DISABLED state, since memory controller interleaves the access across the sockets, out of 256 bytes, 128 bytes are read from local memory and 128 bytes are read from remote memory.
The remote memory accesses end up crossing the QPI link. The impact of this is increased access time for the accesses to the remote memory and the resulting lower performance.

Solution:
As shown below, with BIOS setting NUMA = Enabled, all the accesses go to the same socket (local) memory and there is no crossing of QPI. This results in improved performance because of lower latency of memory accesses.
Key Take Away: Be sure to set NUMA = Enabled in BIOS.

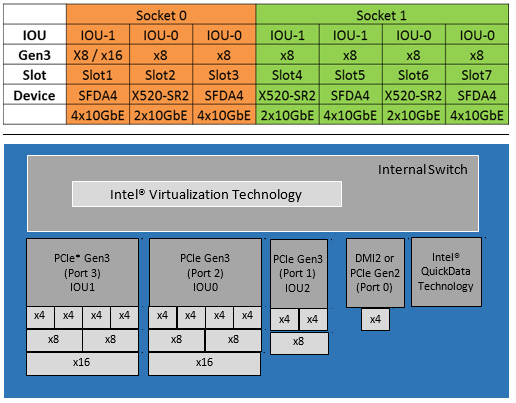
Platform Optimizations – PCIe* Layout and IOU Affinity
Linux Optimizations
Reducing Context Switches with isolcpus
To reduce the possibility of context switch, it is desirable to give a hint to the kernel to refrain from scheduling other user space tasks on to the cores used by DPDK application threads. isolcpus Linux kernel parameter serves this purpose.
For example, if DPDK applications are to run on logical cores 1, 2, and 3, the following should be added to the kernel parameter list:
isolcpus=1,2,3
Note: Even with the isolcpus hint, the scheduler may still schedule kernel threads on the isolated cores. Please note that isolcpus requires a reboot.
Adapt and Update the Sample Application
Now that the relevant sample application has been identified as a starting point to build the end product, the following are the next set of questions to be answered.
Configuration Questions
How to configure the application for best performance?
For example,
- How many queues can be configured per port?
- Can Tx resources be allocated as same size as Rx resources?
- What are the optimum settings for threshold values?
Recommendation: The good news is that the sample application comes with not only optimized code flow but also optimized parameters settings as default values. The recommendation is to use a similar ratio between resources for Tx and Rx. The following are the references and recommendations for Intel® Ethernet Controller 10 Gigabit 82599. For other NIC controllers, please refer to the corresponding data sheets.
How many queues can be configured per port?
Please refer to the white paper Evaluating the Suitability of Server Network Cards for Software Routers for detailed test setup and configuration on this topic.
The following graph (from the above white paper) indicates not to use more than 2 to 4 queues per port since the performance degrades with a higher number of queues.
For the best case scenario, the recommendation is to use 1 queue per port. In case more are needed, 2 queues per port can be considered, but not more than that.

Ratio of the forwarding rate varying the number of hardware queues per port.
Can Tx resources be allocated as same size as Rx resources?
It is a natural tendency to allocate equal-sized resources for Tx and Rx. However, please note that http://dpdk.org/browse/dpdk/tree/examples/l3fwd/main.c shows that optimum default size for number of Tx ring descriptors is 512 as opposed to Rx ring descriptors being 128. Thus the number of Tx ring descriptors is 4 times that of the Rx ring descriptors.

The recommendation is to choose Tx ring descriptors 4 times that of the Rx ring descriptors and not to have them both equal size. The reasoning for this is left as an exercise for the readers to find out.

What are the optimum settings for threshold values?
For instance, http://dpdk.org/browse/dpdk/tree/app/test/test_pmd_perf.c has the following optimized default parameters for the Intel Ethernet Controller 10 Gigabit 82599.

Please refer to Intel Ethernet Controller 10 Gigabit 82599 data sheet for detailed explanations.
Rx_Free_Thresh - A Quick Summary and Key Takeaway: The key takeaway is amortization of the cost of PCIe operation (in updating the hardware register) is done by processing batches of packets (before updating the hardware register).
Rx_Free_Thresh - In Detail: As shown below, communication of packets received by the hardware is done using a circular buffer of packet descriptors. There can be up to 64K-8 descriptors in the circular buffer. Hardware maintains a shadow copy that includes those descriptors completed but not yet stored in memory.
The “Receive Descriptor Head register (RDH)” indicates the in-progress descriptor.
The “Receive Descriptor Tail register (RDT)” identifies the location beyond the last descriptor that the hardware can process. This is the location where software writes the first new descriptor.

During runtime, the software processes the descriptors and upon completion of descriptors, increments the Receive Descriptor Tail registers. However, updating the RDT after each packet has been processed by the software has a cost, as it increases PCIe operations.
Rx_free_thresh represents the maximum number of free descriptors that the DPDK software will hold before sending them back to the hardware. Hence, by processing batches of packets before updating the RDT, we can reduce this PCIe cost of this operation.
Fine-tune with the parameters in the rte_eth_rx_queue_setup ( ) function for your configuration
ret = rte_eth_rx_queue_setup(portid, 0, rmnb_rxd,
        socketid, &rx_conf,
        mbufpool[socketid]);
Compile with the correct optimization flags
Apply the corresponding solution: Software prefetch for memory, block mode for I/O, to hyperthread or not to hyperthread for CPU bound applications.
Software prefetch for memory helps to hide memory latency and thus improves memory bound tasks in data plane applications.
PREFETCHW: Prefetch data into cache in anticipation of write: PREFETCHW, a new instruction from Haswell onward, helps optimizing to hide memory latency and improves network stack. PREFETCHW prefetches data into cache in anticipation of a write.
PREFETCHWT1: Prefetch hint T1 (temporal L1 cache) with intent to write: PREFETCHWT1, a new instruction from Haswell onward, fetches the data to a location in the cache hierarchy specified (T1 => temporal data with respect to first level cache) by an intent to write a hint (so that data is brought into ‘Exclusive’ state via a request for ownership) and a locality hint.
- T1 (temporal data with respect to first-evel cache) – prefetches data into the second level cache.
For more information about these instructions refer to the Intel® 64 and IA-32 Architectures Developer’s Manual.
Running with optimized command-line options
Optimize the application using command line options to improve affinity, locality, and concurrency.
coremask parameter and (wrong) assumption of neighboring cores
The coremask parameter is used with the DPDK application to specify the cores on which to run the application. For higher performance, reducing inter-processor communication cost is a key. The coremask should be selected such that the communicating cores are physical neighbors.
Problem: One may (mistakenly), assume core 0 and core 1 are neighboring cores and may choose the coremask accordingly in the DPDK command-line parameter. Please note that these logical core numbers, and their mapping to specific cores on specific NUMA sockets, can vary from platform to platform. While in one platform core 0 and core 1 may be neighbors, in another platform, core 0 and core 1 may end up being across another socket.
For instance, in a single-socket machine (screenshot shown below), lcore 0 and lcore 4 are siblings of the same physical core (core 0). So the communication cost between lcore 0 and lcore 4 will be less than the communication cost between lcore 0 and lcore 1.

Solution: Because of this, it is recommended that the core layout for each platform be considered when choosing the coremask to use in each case.
Tools – dpdk/tools/cpu_layout.py
Use ./cpu_layout.py in tools directory to find out the socket ID, the physical core ID, and the logical core ID (processor ID). From this information, correctly fill in the coremask parameter with locality of processors in mind.
Below is the cpu_layout of a dual socket machine.
The list of physical cores is [0, 1, 2, 3, 4, 8, 9, 10, 11, 16, 17, 18, 19, 20, 24, 25, 26, 27]
Please note that physical core numbers 5, 6, 7, 12, 13, 14, 15, 21, 22, 23 are not in the list. This indicates that one cannot assume that the physical core numbers are sequential.
How to find out which lcores are hyperthreads from the cpu_layout?
In the picture below, Lcore 1 and lcore 37 are hyperthreads in socket 0. Assigning intercommunicating tasks to lcore 1 and lcore 37 will have lower cost and higher performance compared to assigning tasks to lcore 1 with any other core (other than lcore 37).

Save core 0 for Linux use and do not use core 0 for the DPDK
Refer below for the initialization of the DPDK application. Core 0 is being used by the primary core.
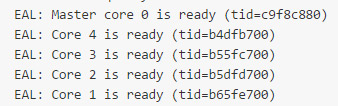
Do not use core 0 for the DPDK applications because it is used by Linux as the primary core. For example, using l3fwd –c 0x1 … should be avoided since that would be using the core 0 (which is serving the functionality of primary core) for l3fwd DPDK application as well.
Instead, the command l3fwd –c 0x2 …. can be used so that l3fwd application uses core 1.
In realistic use cases like Open vSwitch* with DPDK, a control plane thread pins to the primary core, and is responsible for responding to control plane commands from the user or the SDN controller. So, the DPDK application should not use the primary core (core 0), and the core bit mask in the DPDK command line should not set bit 0 for the coremask.
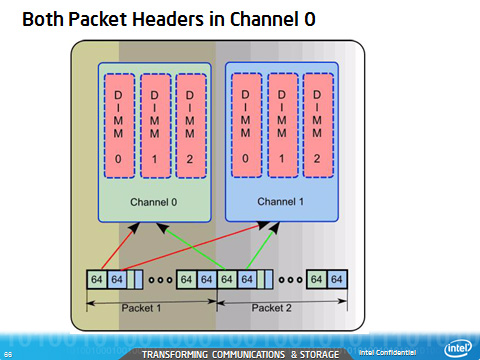
Correct use of the Channel Parameter
Be sure to make correct use of the channel parameter. For example, use CHANNEL PARAMETER N = 3 for a 3 channel memory system.

DPDK Micro-benchmarks and auto-tests
The following table tabulates DPDK micro-benchmarks and auto-tests that are available as part of DPDK applications and examples. Developers use these micro-benchmarks to do focused performance measurements for evaluating performance.
The auto-tests are used for functionality verification.
The following are a few sample capabilities of distributor micro-benchmarks for performance evaluation.
How can I measure the time taken for a round-trip of a cache line between two cores and back again?
Time_cache_line_switch( ) function in http://dpdk.org/browse/dpdk/tree/app/test/test_distributor_perf.c can be used to time the number of cycles to round-trip a cache line between two cores and back again.
How can I measure the processing time per packet?
Perf_test( ) function in http://dpdk.org/browse/dpdk/tree/app/test/test_distributor_perf.c sends in 32 packets at a time to the distributor and verifies at the end that worker thread got all of them and finally how long the processing per packet took.

How can I find the performance difference between single producer/single consumer (sp/sc) and multi-producer/multi-consumer (mp/mc)?
Running ring_perf_auto_test in /app/test gives the number of CPU cycles, in the following screenshot output, to study the performance difference between single producer/single consumer and multi-producer/multi-consumer. It also shows the differences for different bulk sizes.
The key takeaway: Using sp/sc with higher bulk sizes gives higher performance.
Please note that even though the default ring_perf_autotest runs through the performance test with block sizes of 8 and 32, one can update the source code to include other desired sizes (modify the array bulk_sizes[] to include bulk sizes of interest). For instance, find below the output with the block sizes 1, 2, 4, 8, 16, and 32.
2-Socket System – Huge Page Size = 2 Meg


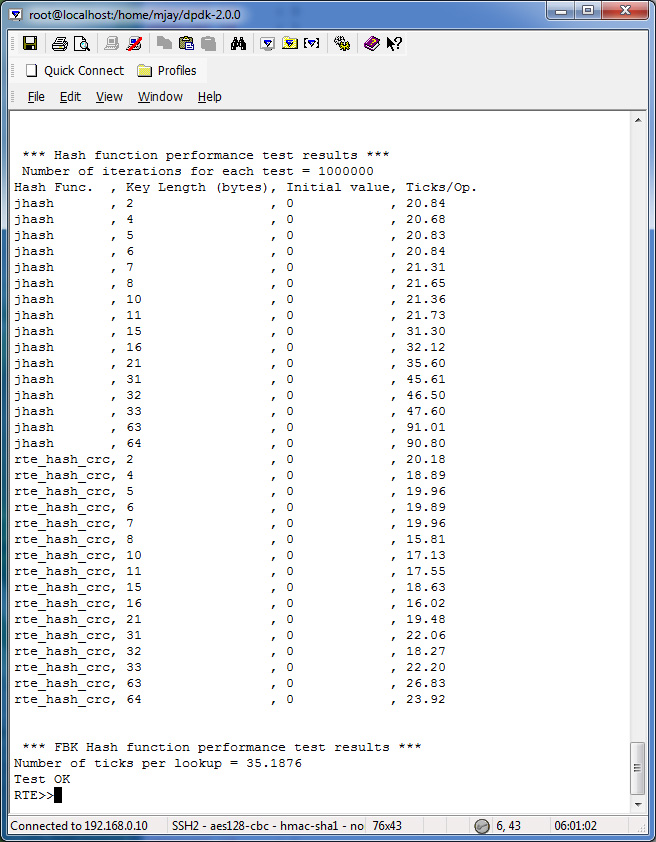
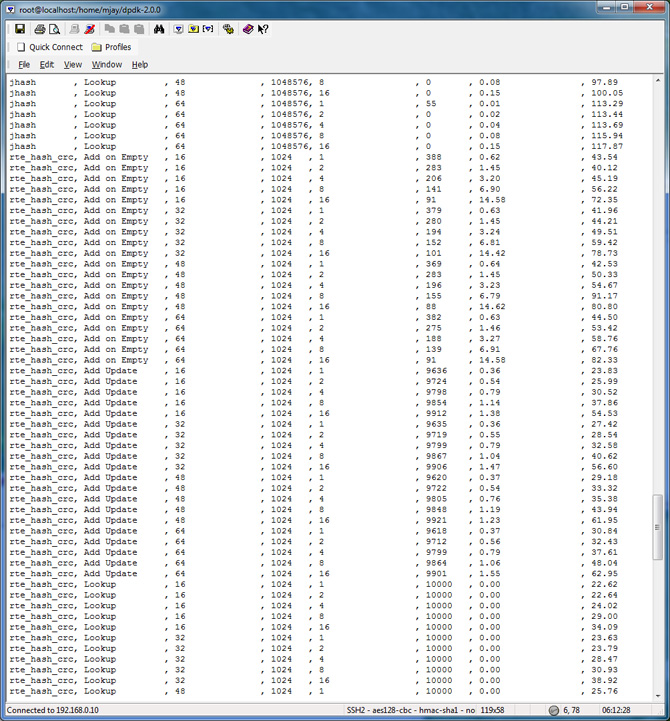
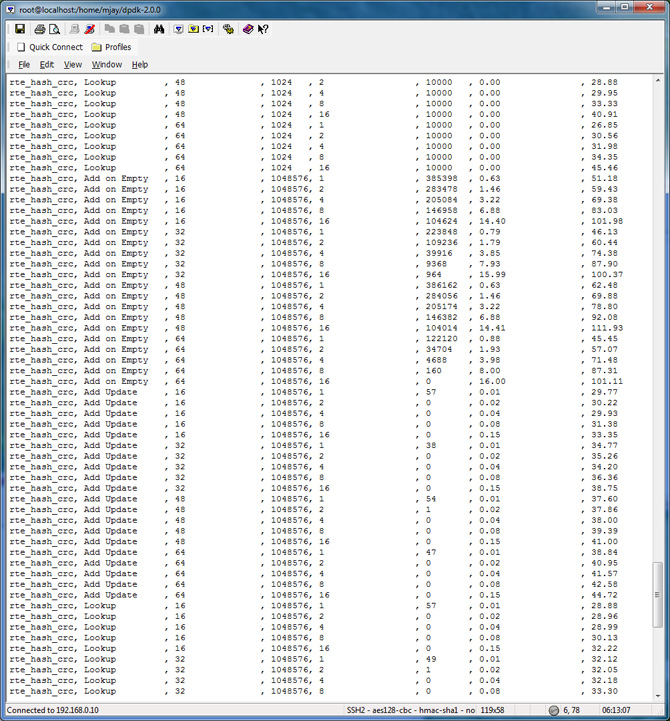
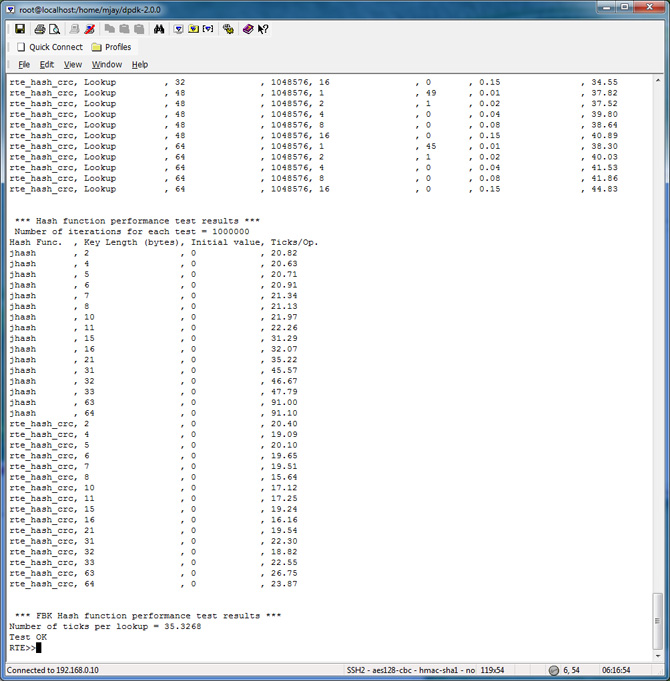
hash_perf_autotest runs through 1,000,000 iterations for each test varying the following parameters and reports Ticks/Op for each combination:
| Hash Function | Operation | Key Size (bytes) | Entries | Entries per Bucket |
|---|---|---|---|---|
| a) Jhash, b) Rte_hash_CRC |
a) Add On Empty, b) Add Update, c) Lookup |
a) 16, b) 32, c) 48, d) 64 |
a) 1024, b) 1048576 |
a) 1, b) 2, c) 4, d) 8, e) 16 |
The Appendix has the detailed test output and the commands that you can use to evaluate performance with your platform.
The summary of the result is tabulated and charted below:

DPDK Micro-benchmarks and Auto-tests
| Sl No. | Focus Area to Improve | Use These Micro-Benchmarks and Auto-Tests |
|---|---|---|
| 1 | Ring For Inter-Core Communication |
|
| 2 | Memcopy |
|
| 3 | Mempool | “n_get_bulk” “n_put_bulk”
|
| 4 | ||
| 5 | Hash | Rte_jhash, rte_hash_crc;
|
| 6 | ACL Lookup | http://dpdk.org/browse/dpdk/tree/app/test/test_acl.c |
| 7 | LPM | Rule with depth > 24 1) Add, 2) Lookup, 3) Delete http://dpdk.org/browse/dpdk/tree/app/test/test_lpm.c http://dpdk.org/browse/dpdk/tree/app/test/test_lpm6.c Large Route Tables: http://dpdk.org/browse/dpdk/tree/app/test/test_lpm6_routes.h |
| 8 | Packet Distribution | http://dpdk.org/browse/dpdk/tree/app/test/test_distributor_perf.c |
| 9 | NIC I/O Benchmark |
|
| 10 | NIC I/O + Increased CPU processing | Increased CPU processing – NIC h/w + PMD + hash/lpm Examples/l3fwd |
| 11 | Atomic Operations/ Lock-rd/wr | http://dpdk.org/browse/dpdk/tree/app/test/test_atomic.c http://dpdk.org/browse/dpdk/tree/app/test/test_rwlock.c |
| 12 | SpinLock |
|
| 13 | Software Prefetch | http://dpdk.org/browse/dpdk/tree/app/test/test_prefetch.c. Its usage: http://dpdk.org/browse/dpdk/tree/lib/librte_table/rte_table_hash_ext.c |
| 14 | Packet Distribution | http://dpdk.org/browse/dpdk/tree/app/test/test_distributor_perf.c |
| 15 | Reorder and Seq. Window | http://dpdk.org/browse/dpdk/tree/app/test/test_reorder.c |
| 16 | Software Load Balancer | |
| 17 | ip_pipeline | Using the packet framework to build a pipeline http://dpdk.org/browse/dpdk/tree/app/test/test_table.c ACL Using Packet Framework http://dpdk.org/browse/dpdk/tree/app/test/test_table_acl.c |
| 18 | Reentrancy | http://dpdk.org/browse/dpdk/tree/app/test/test_func_reentrancy.c |
| 19 | mbuf | http://dpdk.org/browse/dpdk/tree/app/test/test_mbuf.c |
| 20 | memzone | http://dpdk.org/browse/dpdk/tree/app/test/test_memzone.c |
| 21 | Ivshmem | http://dpdk.org/browse/dpdk/tree/app/test/test_ivshmem.c |
| 22 | Virtual PMD | http://dpdk.org/browse/dpdk/tree/app/test/virtual_pmd.c |
| 23 | QoS | http://dpdk.org/browse/dpdk/tree/app/test/test_meter.c http://dpdk.org/browse/dpdk/tree/app/test/test_red.c http://dpdk.org/browse/dpdk/tree/app/test/test_sched.c |
| 24 | Link Bonding | http://dpdk.org/browse/dpdk/tree/app/test/test_link_bonding.c |
| 25 | Kni |
|
| 26 | Malloc | http://dpdk.org/browse/dpdk/tree/app/test/test_malloc.c |
| 27 | Debug | http://dpdk.org/browse/dpdk/tree/app/test/test_debug.c |
| 28 | Timer | http://dpdk.org/browse/dpdk/tree/app/test/test_cycles.c |
| 29 | Alarm | http://dpdk.org/browse/dpdk/tree/app/test/test_alarm.c |
Compiler Optimizations
Reference: Pyster - Compiler Design and construction – “Adding optimizations to a compiler is a lot like eating chicken soup when you have a cold. Having a bowl full never hurts, but who knows if it really helps. If the optimizations are structured modularly so that the addition of one does not increase compiler complexity, the temptation to fold in another is hard to resist. How well the techniques work together or against each other is hard to determine."
Performance Optimization and Weakly Ordered Considerations
Background: Linux Kernel synchronization primitives contain needed memory barriers as shown below (both uniprocessor and multiprocessor versions)
| Smp_mb ( ) | Memory barrier |
|---|---|
| Smp_rmb ( ) | Read memory barrier |
| Smp_wmb ( ) | Write memory barrier |
| Smp_read_barrier_depends ( ) | Forces subsequent operations that depend on prior operations to be ordered |
| Mmiowb ( ) | Ordering on MMIO writes that are guarded by global spinlocks |
Code that uses standard synchronization primitives (spinlocks, semaphores, read copy update) should not need explicit memory barriers, since any required barriers are already present in these primitives.
Challenge: If you are writing code bypassing these standard synchronization primitives for optimization purposes, then consider your requirement in using the proper barrier.
Consideration: x86 provides “process ordering” memory model in which writes from a given CPU are seen in order by all CPUs, and weak consistency, which permits arbitrary reordering, limited only by explicit memory-barrier instructions.
The smp_mp ( ), smp_rmb ( ), smp_wmb ( ) primitives also force the compiler to avoid any optimizations that would have the effect of reordering memory optimizations across the barriers.
Some SSE instructions are weakly ordered (clflush and non-temporal move instructions. CPUs that have SSE can use mfence for smp mb(), lfence for smp rmb(), and sfence for smp wmb().
Appendix
Pmd_perf_autotest
To evaluate the performance in your platform, run /app/test/pmd_perf_autotest
The key takeaway: The cost for RX+TX cycles per packet in test Polled Mode Driver is 54 cycles
With 4 ports and –n = 4 memory channels

What if you need to find the cycles taken for only rx? Or only tx?
To find rx-only time, use the command set_rxtx_anchor rxonly before issuing the command pmd_perf_autotest.
Similarly to find tx-only time, use the command set_rxtx_anchor txonly before issuing the command pmd_perf_autotest.
Packet Size = 64B # of channels n= 4
| # of cycles per packet | TX+RX Cost | TX only Cost | Rx only Cost |
|---|---|---|---|
| With 4 ports | 54 cycles | 21 cycles | 31 cycles |
Below is the screen output for the rxonly and txonly respectively.


Hash Table Performance Test Results
To evaluate the performance in your platform, run /app/test/hash_perf_autotest


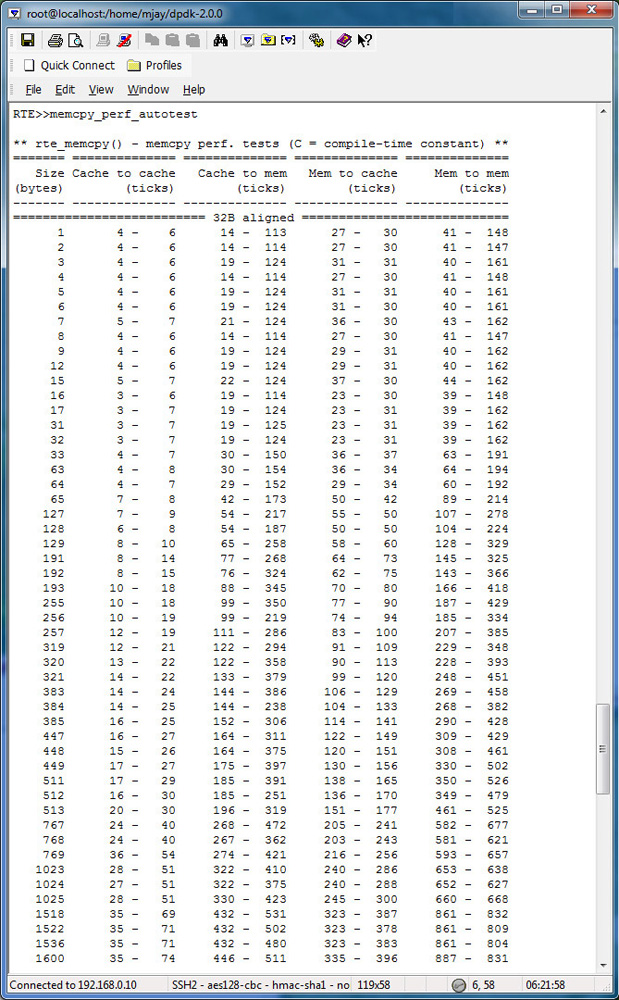
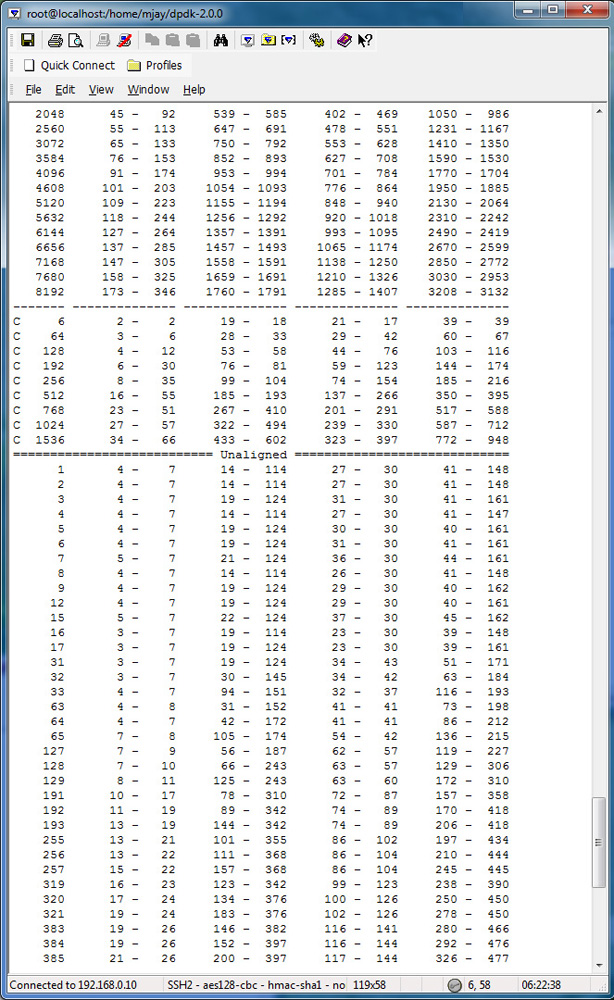
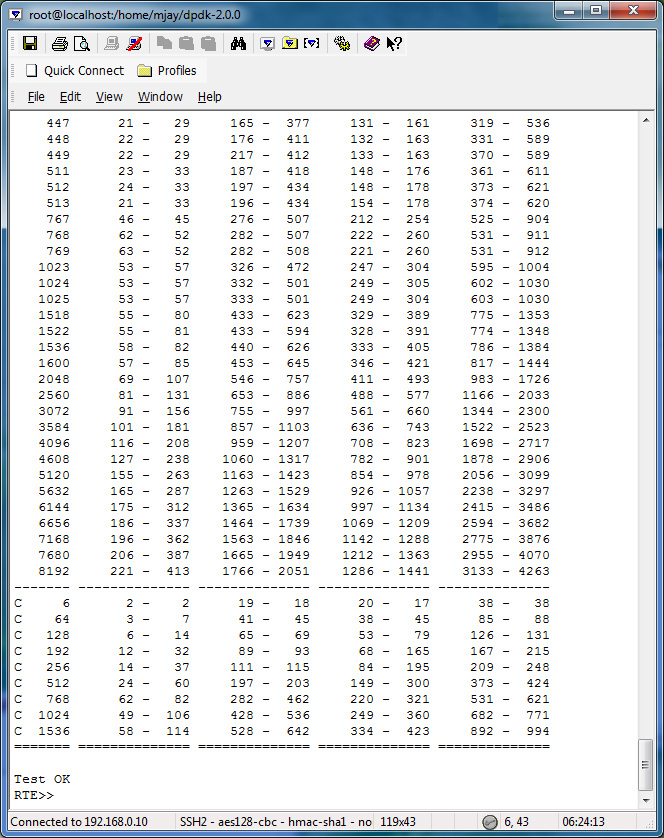
Memcpy_perf_autotest Test Results
To evaluate the performance in your platform, run /app/test/memcpy_perf_autotest, for both 32 bytes aligned and unaligned.
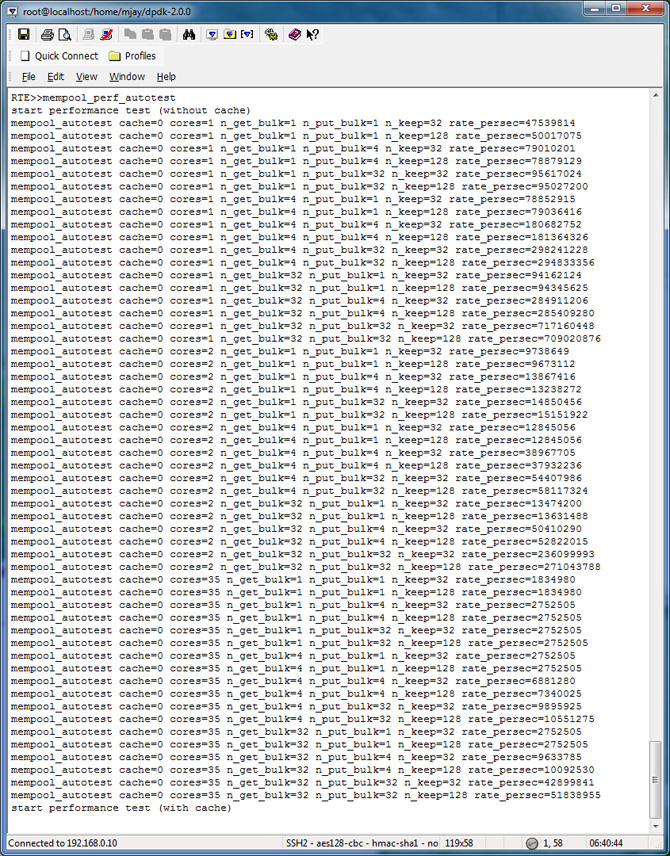
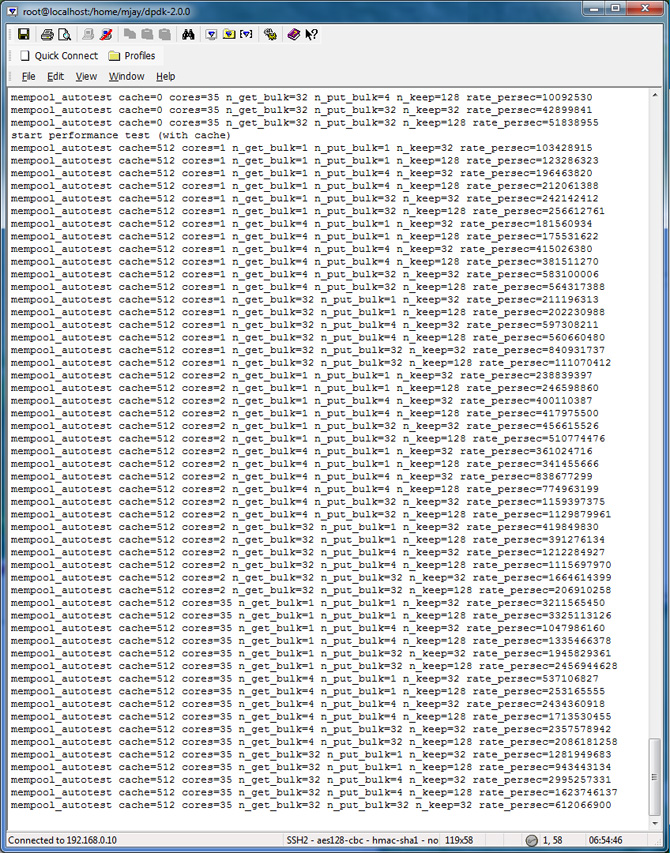
Mempool_perf_autotest Test Results
| Core Configuration | Cache Object | Bulk Get Size | Bulk Put Size | # of Kept Objects |
|---|---|---|---|---|
| a) 1 Core b) 2 Cores c) Max. Cores |
a) with cache object b) without cache object |
a) 1 b) 4 c) 32 |
a) 1 b) 4 c) 32 |
a) 32 b) 128 |
To evaluate the performance in your platform, run /app/test/mempool_perf_autotest.
Timer_perf_autotest Test Results
| # of Timers Configuration | Operations Timed |
|---|---|
| a) 0 Timer b) 100 Timers c) 1000 Timers d) 10,000 Timers e) 100,000 Timers f) 1,000,000 Timers |
- Appending - Callback - Resetting |
To evaluate the performance in your platform, run /app/test/timer_perf_autotest

Acknowledgments
Acknowledgments go to many people for their valuable inputs – early access customers, architects, design engineers, encouragements from managers, platform application engineers, DPDK community, and network builders to mention a few.
About the Author
M Jay joined Intel in 1991 and has been in various roles and divisions with Intel, including as a 64 bit CPU front side bus architect and a 64 bit HAL developer, before joining the DPDK team in 2009. M Jay holds 21 US Patents, both individually and jointly, all issued while working in Intel.He was awarded the Intel Achievers Award in 2016.
References
For cookbook-style instructions on how to do hands-on performance profiling of your DPDK code with VTune, refer to the companion article Profiling DPDK Code with Intel® VTune™ Amplifier.
Code Optimization Handout 20 - CS 143 Summer 2008 by Maggie Johnson
Document #5571159 Intel® Xeon® processor E7-8800/4800 v3 Performance Tuning Guide
Intel® Optimizing Non-Sequential Data Processing Applications – Brian Forde and John Browne
Measuring Cache and Memory Latency and CPU to Memory Bandwidth - For use with Intel® Architecture – Joshua Ruggiero
Compile with Performance Settings, Use PGO, Evaluate IPP / SSE 4.2 Strings
Use PCM to determine L3 Cache Misses, Core transitions and Keep data in L3 Cache
Tuning Applications Using a Top-down Microarchitecture Analysis Method
Intel® Processor Trace architecture details can be found in the Intel® 64 and IA-32 Architectures Software Developer Manuals
Evaluating the Suitability of Server Network Cards for Software Routers
Red Hat Enterprise Linux 6 Performance Tuning Guide
Network Function Virtualization: Virtualized BRAS with Linux* and Intel® Architecture
A Path to Line-Rate-Capable NFV Deployments with Intel® Architecture and the OpenStack® Juno Release
Memory Ordering in Modern Microprocessors – Paul E McKenney Draft of 2007/09/19 15:15
Additional Reading - Topic Links