The contents of this guide work for version 4.19 of the Unreal Engine.
This is a tutorial to help developers improve the performance of their games in Unreal Engine* 4 (UE4). In this tutorial, we go over a collection of tools to use within and outside of the engine, as well some best practices for the editor, and scripting to help increase the frame rate and stability of a project.
The goal of this tutorial is to identify where performance issues occur and provide several methods to tackle them.
Version 4.14 was used in the making of this guide.
Units
For measuring improvements made with optimizations, frames per second (fps) and duration in milliseconds per frame (ms) are considered.
This chart illustrates the mapping between average fps and ms.
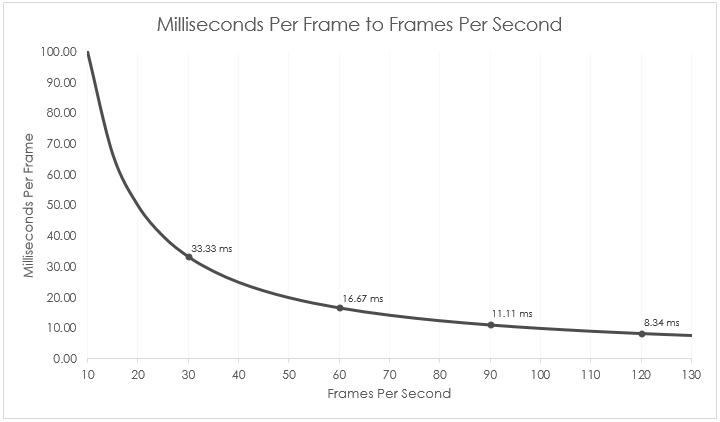
To find the ms of any fps, simply get the reciprocal of that fps and multiply by 1000.

Using milliseconds to describe improvements in performance helps better quantify level of optimization needed to hit the fps target.
For instance, with an improvement of 20 fps to a scene:
- 100 fps to 120 fps is an improvement of 1.66 ms
- 10 fps to 30 fps is an improvement of 66.67 ms
Tools
To get started, let’s look at three tools for understanding what is happening under the hood of the engine: UE4 CPU Profiler, UE4 GPU Visualizer, and the Intel® Graphics Performance Analyzers (Intel® GPA).
Profiler
The UE4 CPU Profiler tool is an in-engine monitor that allows you to see the performance of the game, either live or from a captured section.
Find the Profiler under Window > Developer Tools > Session Frontend.

Figure 1: Finding the Session Frontend window.
In Session Frontend, select the Profiler tab.
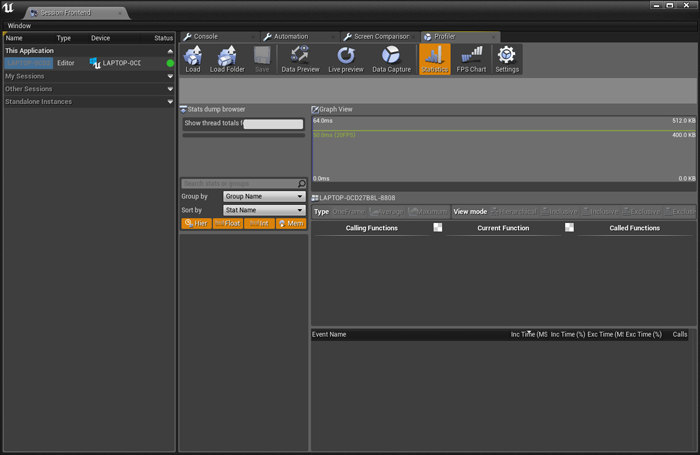
Figure 2: The Profiler in the Unreal Engine.
Now that we are in the Profiler window, select Play-In-Editor (PIE), then select Data Preview and Live Preview to see the data being collected from the game. Select the Data Capture option to begin capturing data from the game, and then deselect it to save that data for later viewing.

Figure 3: Viewing processes within the Profiler.
From the Profiler, the time of every action and call is reflected in ms. Each area can be examined to see how it affects the frame rate within the project.
For an in-depth explanation of the Profiler, see the Epic documentation.
GPU Visualizer
The UE4 GPU Visualizer identifies the cost of rendering passes and provides a high-level view of what is happening within a scene snapshot.
The GPU Visualizer can be accessed from the in-game developer console by entering ProfileGPU.
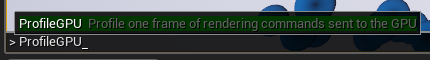
Figure 4: ProfileGPU console command.
Once the command is entered, the GPU Visualizer window pops open. It shows the time of each rendering pass within the snapshot and a rough idea of where in the scene those passes took place.

Figure 5: Viewing processes within the GPU Visualization.
As with the Profiler, identifying the items that take the most processing time will give clues about where to start optimization efforts.
For an in-depth explanation of the GPU Visualizer, see the Epic documentation.
Intel® Graphics Performance Analyzers (Intel® GPA)
Intel® Graphics Performance Analyzers (Intel® GPA) is a suite of graphics analysis and optimization tools that help developers get more performance out of their graphics applications.
For this guide, we will focus on two aspects of the suite: the real-time Analyze Application, and Frame Analyzer. To get started, download GPA from the Intel® Developer Zone. Once installed, build the Unreal project with the Development Build Configuration selected.
With the build complete, go into Analyze Application of the Graphics Monitor and select the executable location in the command line and run it.
The game will open normally, but now a statistics guide is visible in the top-left corner of the screen. To expand the display, press CRTL+F1 once for real-time metrics information, and again to get a list of keyboard shortcuts of experiments available to be applied as the game is running.
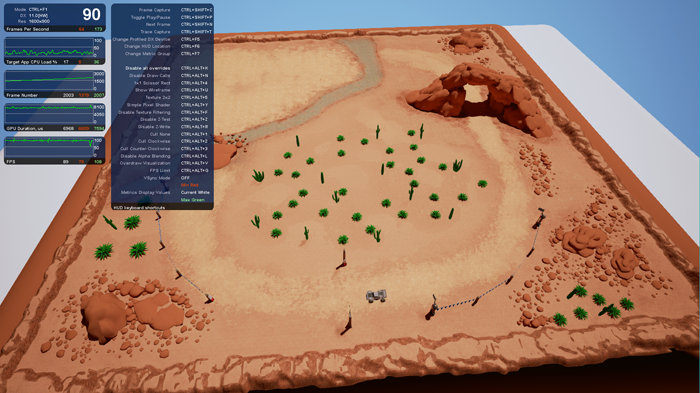
Figure 6: The Intel® GPA overlay in game.
To get a frame to analyze in Frame Analyzer, two additional steps are needed in-game.
First is to turn on Toggle Draw Events. To do this, type ToggleDrawEvents into the game console.

Figure 7: ToggleDrawEvents console command.
Turning this on attaches names to the draw calls being made by the engine so that we have context when looking at the capture later in Frame Analyzer.
Finally, we capture a frame with the keyboard shortcut CTRL+SHIFT+C.
With the frame saved, open Frame Analyzer from the Graphics Monitor and select the frame to be loaded. After the capture is processed all the information about what occurred graphically within the frame presented.

Figure 8: The Intel® GPA.
For an in-depth explanation, see the Intel GPA documentation.
Intel® Graphics Performance Analyzers (Intel® GPA) Usage Example
While it may look complicated seeing all the data in Intel GPA, we start by just looking at the bigger chunks of information first. In the top-right corner of the window, set the graph to be GPU Duration on the X and Y axes; this gives us a graph of which draw calls take up the most time in our frame.
In this example, a capture of a desert landscape scene, we see there is a massive draw call in the base pass. When the large draw call is selected, and Highlighted is selected in the Render Target Preview area, we see that the spike was caused by the landscape (highlighted in pink) within the scene. If we dive into the Process Tree List (just above the preview area) to find the selected draw call, we see that the landscape has 520200 primitives and takes a GPU duration of 1,318.5 (1.3185 ms).
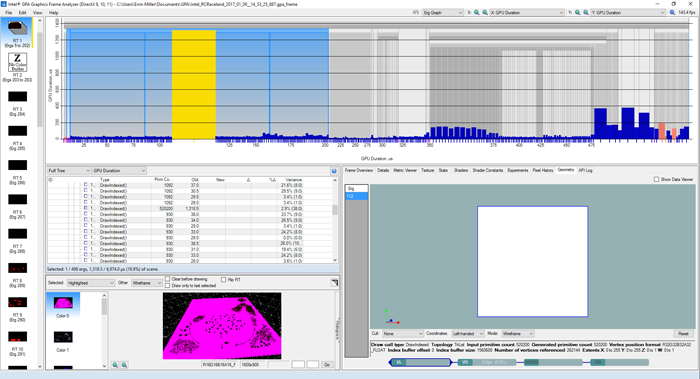
Figure 9: Finding the largest duration within the scene.
Once we identify what caused the spike we can try to optimize it.
As a first measure, the landscape is resampled down by using Manage Mode for the landscaping tool, which reduces its primitive count to 129032. This reduces the GPU duration to 860.5, and gives an improvement of 5 percent to the scene.

Figure 10: Seeing the decreased duration.
To continue to lower the cost of the landscape, we can also look its materials. The landscape has a layer blend material that uses thirteen 4096 x 4096 (4k) textures, which totals 212.5 MB of texture streaming.

Figure 11: Viewing rendered textures in the Intel® GPA.
By compressing all the landscape textures to 2048 x 2048 (2k), we reduced the GPU duration to 801.0 and got another improvement of 6 percent.
Reducing the texture streaming of the landscape to 53.1 MB and cutting the overall triangle count of the scene allowed the project to run better on Intel graphics. This is all while only decreasing the visual fidelity of the landscape by a small amount for the project.

Figure 12: Seeing the decrease in duration with texture reduction.
Overall, just changing the landscape of the scene with the resampling and changes in textures, we got an optimization of:
- 40 percent (1318.5 to 801) reduction in the GPU duration of the landscape process
- An improved fps of 18 (143 to 161)
- A reduction of 0.70 ms per frame