Overview
Intel® Advisor collection can be sped up, and the size of samples reduced, by using the Instrumentation and Tracing Technology (ITT) APIs. These ITT APIs were supported in the Intel® Advisor survey collection since the product release but now, as from Intel® Advisor 2018, you can also use the APIs on Trip Counts and FLOP collection. This can make the Roofline analysis an option for larger and longer running applications.
In this article, we will show how to use the collection control APIs to command Intel® Advisor when to start and stop the collection of performance data during the execution of your target application.
Background
Intel® Advisor typically starts collecting data as from the moment the analysis is started. As such, Intel® Advisor may be collecting data for sections of the large codebase in which you may not have interest. With the collection control ITT APIs, you can choose which sections of your source code that Intel® Advisor should monitor and record performance data.
Usage example: Focus on a specific code section
The first step is to wrap your source code of interest between resume and pause APIs methods and then start Intel Advisor in paused mode. When Intel Advisor hits the resume method, it will start collecting performance data and stop when it sees the pause method.
Below are a series of detailed steps with a small code-snippet to get you started:
- First, your C/C++ application needs to understand the ITT APIs. In your source code, include the
"ittnotify.h"header file, located in the include directory where Intel Advisor has been installed. By default, the installation path on Windows is:
On Linux, the default path will be:C:\Program Files (x86)\IntelSWTools\Advisor 2018\include/opt/intel/advisor_2018/includeNote: The
"ittnotify.h"header file contains all the ITT APIs templates that you can use for instrumentation.Include the path to the header file above so that your compiler knows where to find the library. In Microsoft Visual Studio for example, navigate to
Property Pages>C/C++>General>Additional Include Directories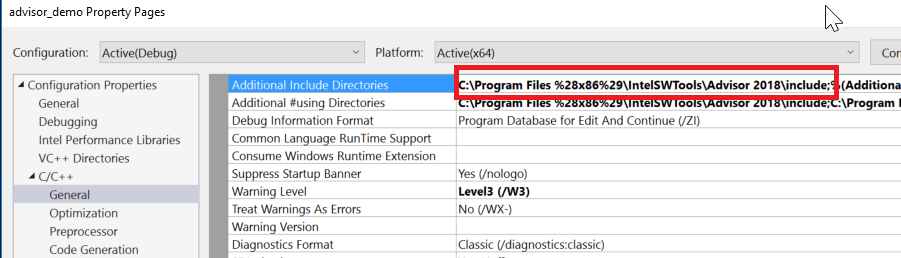
- Finally, link to the ITT library (
libittnotify.lib) and recompile your application.In Visual Studio, navigate to the Linker settings (Property Pages>Linker>Input>Additional Include Directories) and add the path to the library. By default, on Windows, the path will be:
On Linux, the default path is:C:\Program Files (x86)\IntelSWTools\Advisor 2018\lib64\libittnotify.lib/opt/intel/advisor_2018/. Then, you would configure your build scripts to include the path to the library and link to thelibittnotify.alibrary by passing-littnotifyto your compiler. - Next, you need to start Intel Advisor in Paused mode. Look for the Play with a Pause symbol icon like the one below:
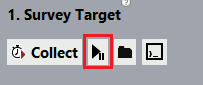
In Intel Advisor, the Survey Analysis and the Trip Counts and FLOP Analysis support the collection control APIs.
Example:
#include "ittnotify.h"

int main(int argc, char* argv[])
{
        // Do initialization work here
        __itt_resume(); //Intel Advisor starts recording performance data
        for (int i=0;i<size;i++)
        {
               do_some_math();
        }
        __itt_pause(); // Intel Advisor stops recording performance data

        for (int i=0;i<size;i++)
        {
               do_some_other_math();
        }

       return 0;
}
In the scenario above, Intel Advisor will give you performance data for the loop containing the do_some_math() method and not the one containing the do_some_other_math() method. If you draw the roofline model for that analysis, you would see one dot on the graph, as opposed to two, if you were to run Intel Advisor without the collection control APIs.