Overview of Intel® Time Coordinated Computing
As the demand for real-time applications and real-time systems continues to grow, developers need methods of verifying that hard real-time deadlines are met—whether they’re measured in clock cycles, milliseconds, or even nanoseconds.
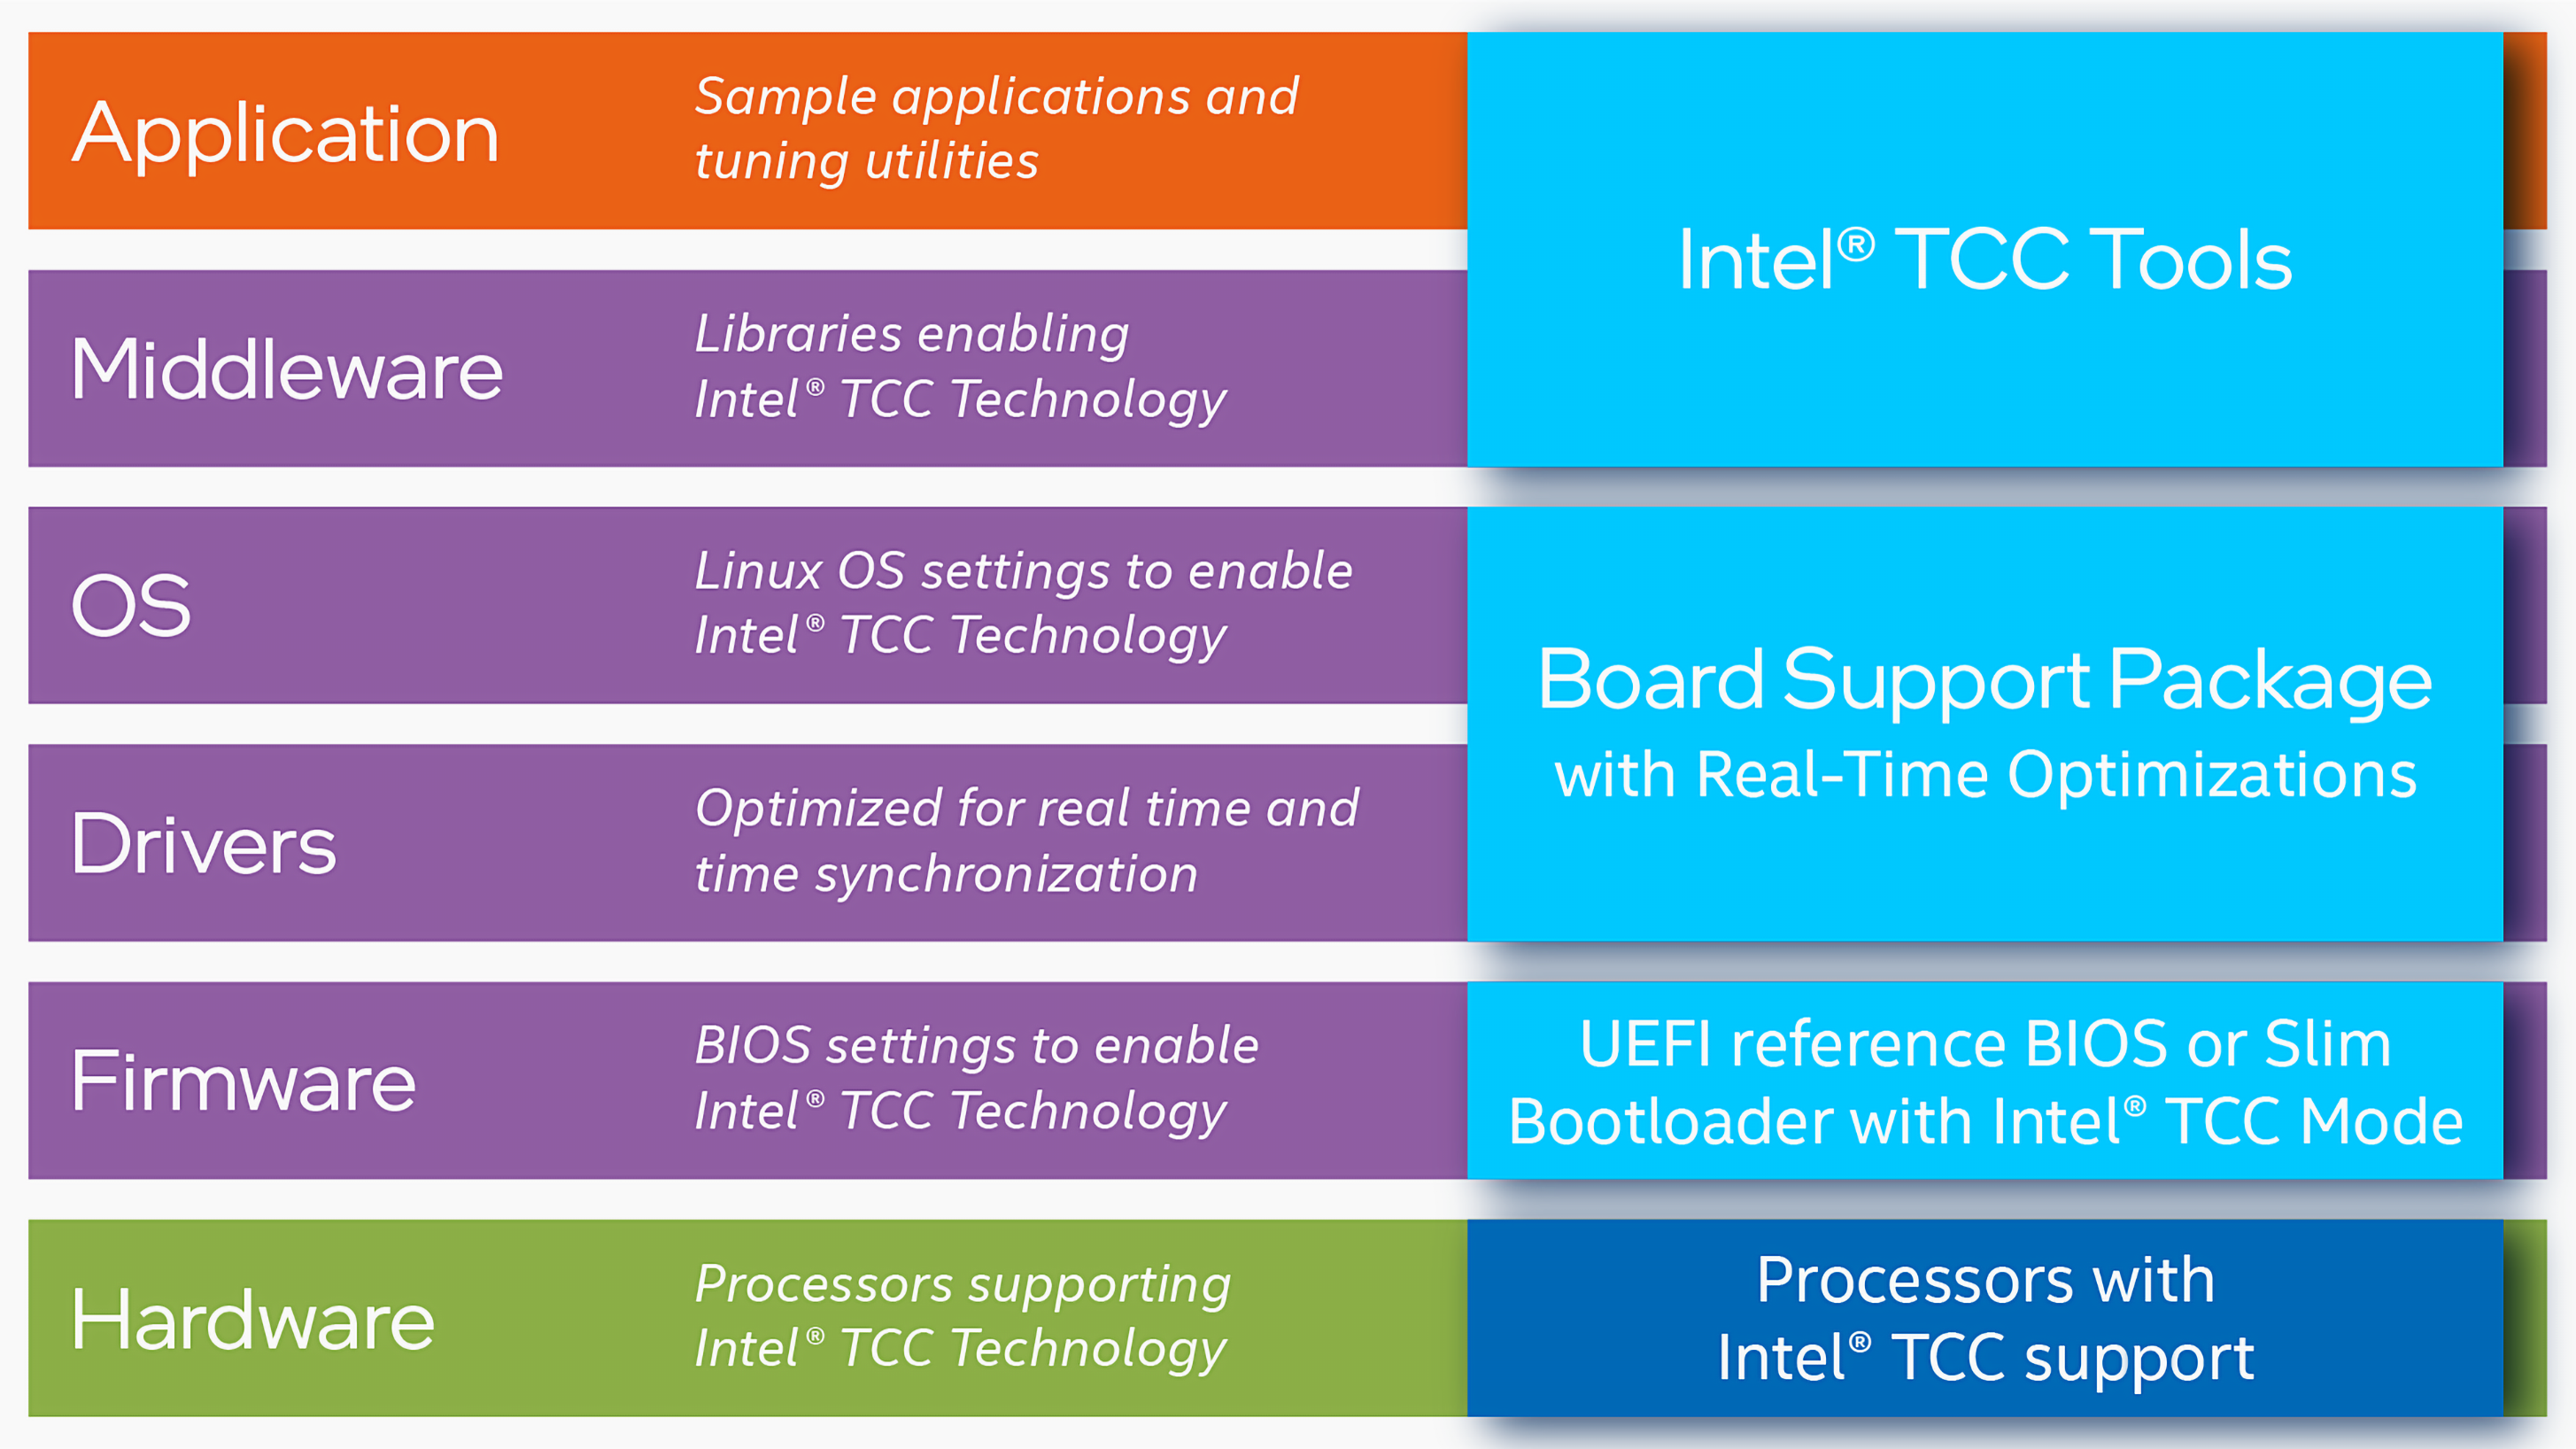
To help developers determine if applications can meet real-time requirements, Intel has developed a set of resources for time-critical computing. They include real-time hardware processors optimized for real-time applications and a system software stack. The system software stack includes Intel® TCC Tools which helps address optimizations, and measurement and analysis tools used to investigate what may be affecting real-time performance. Intel® TCC Tools include a real-time readiness checker and real-time application measurement library.
Readiness Checker Aids the Need for Speed in Real-Time Applications
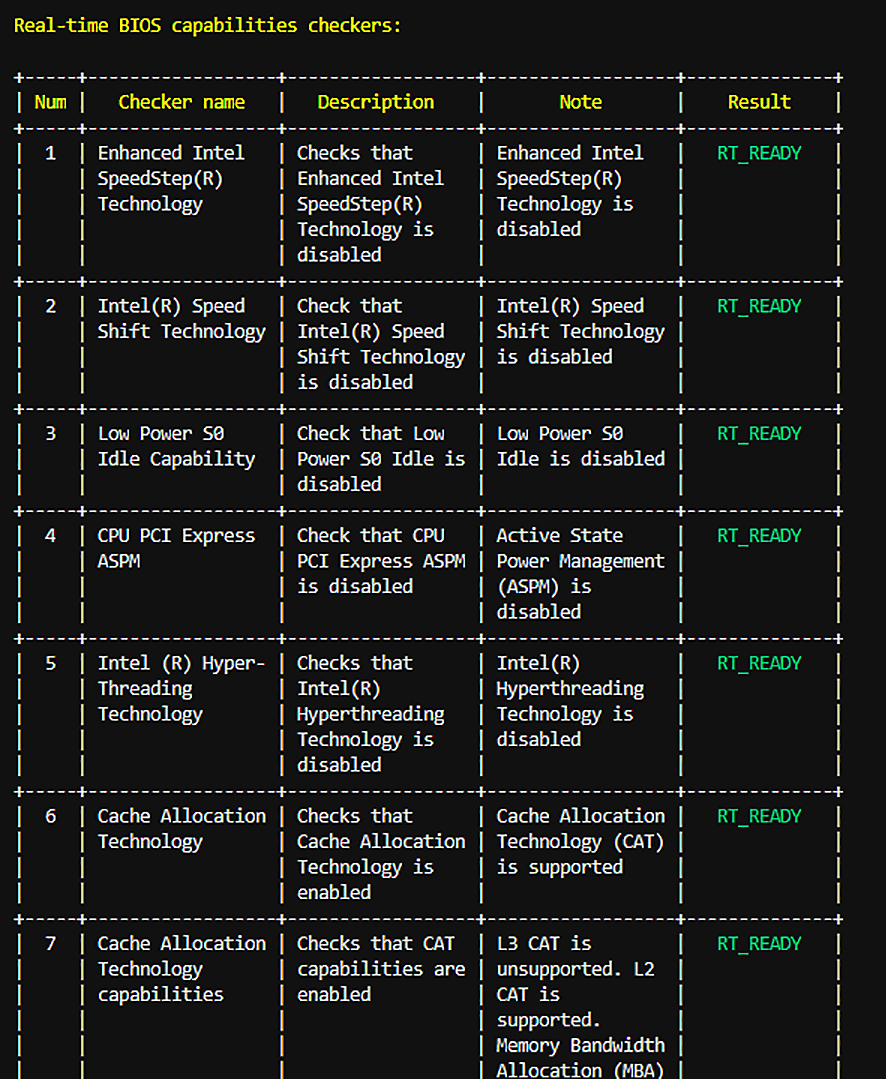
Real-time readiness checker is a command-line tool that performs a fast system pass/fail check for developers. It identifies issues that may affect real-time performance by checking processor model, BIOS version and settings, and other dependencies. Results indicate corrective actions to help ensure that the code is real-time ready.
Using this command-line utility, with a single command, the real-time readiness checker indicates any red flags in the system configuration, boot firmware setup, real-time kernel, or cache allocation that would prevent real-time applications from successfully executing.
A complete list of checks that are performed can be found in the Intel® TCC Tools Developer Guide. The real-time readiness checker provides great value for initial setup checks early in the development process, as well as for debugging in the later phase of the development.
Measurement Library Uncovers Timing Hotspots
The measurement library is a set of C APIs that analyze the behavior of a real-time application to identify bottlenecks. It uses the CPU timestamp counter (TSC) to collect latency data of a specific task in an application for workload latency analysis.
The measurement library can be used throughout the development process:
- During initial setup of your real-time system
- When the initial configuration with Intel® TCC Tools mode is enabled
- To help analyze the results after using other Intel® TCC Tools features that tune the hardware, including cache allocation and data streams optimizer
The measurement library simplifies real-time code instrumentation with a suite of lightweight APIs that offer minimum overhead and high measurement precision. Measuring code doesn’t have a significant impact on code execution time, which is a critical factor in gaining a true understanding of an application’s performance. The measurement library also offers a thorough way to instrument real-time code, collect latency measurements, and perform initial analysis of possible code hotspots.
Watch the following video for more in-depth information on how to get the most out of the measurement library.
Measurement Library APIs
The comprehensive list of APIs included in the measurement library lets developers indicate the beginning and end of code sections to be measured, set deadline values and handlers for missed deadlines, and capture results into a file in JSON format or for analysis with Intel® VTune™ Profiler or other software.
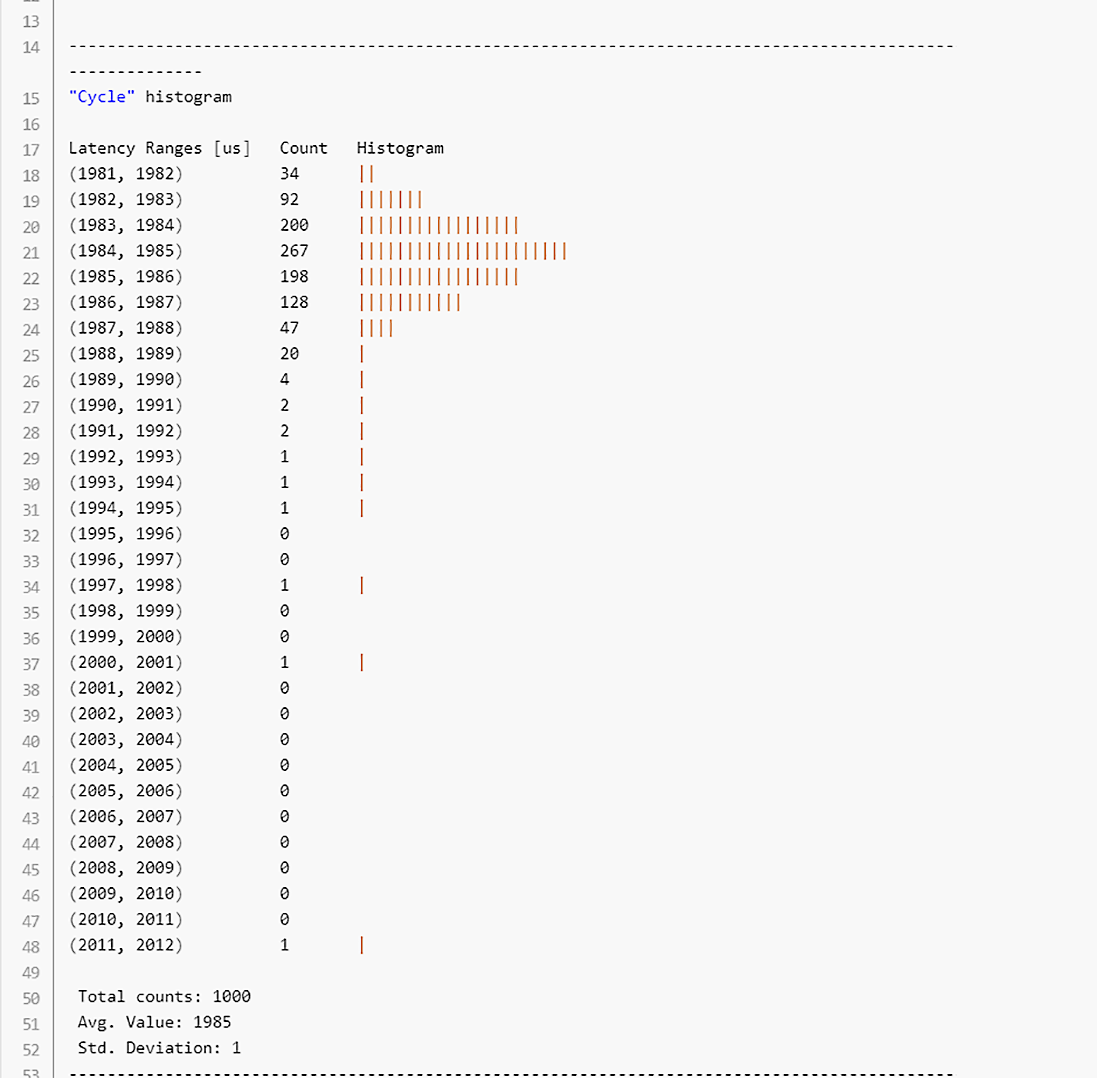
Measurement library APIs can be used simultaneously in multiple places within a real-time application, enabling examination of process timing within a loop as well as the overall process timing. This granularity can help determine exactly where the code is missing critical timing deadlines. Additionally, the data collected by the measurement library can be used to produce histograms that help analyze execution time distribution of each instrumented code part.
The measurement library supports offline or postprocess analysis of measurements as well as the ability to monitor performance while an application is running.
Postprocess analysis enables inspection and evaluation of the results on the same system or a different system while the real-time application isn’t running. Developers can analyze the distribution of execution times to determine:
- If there’s a source of jitter.
- Whether an interrupt handler is interfering with the application.
- Whether the application itself is causing missed deadlines, perhaps due to cache misses.
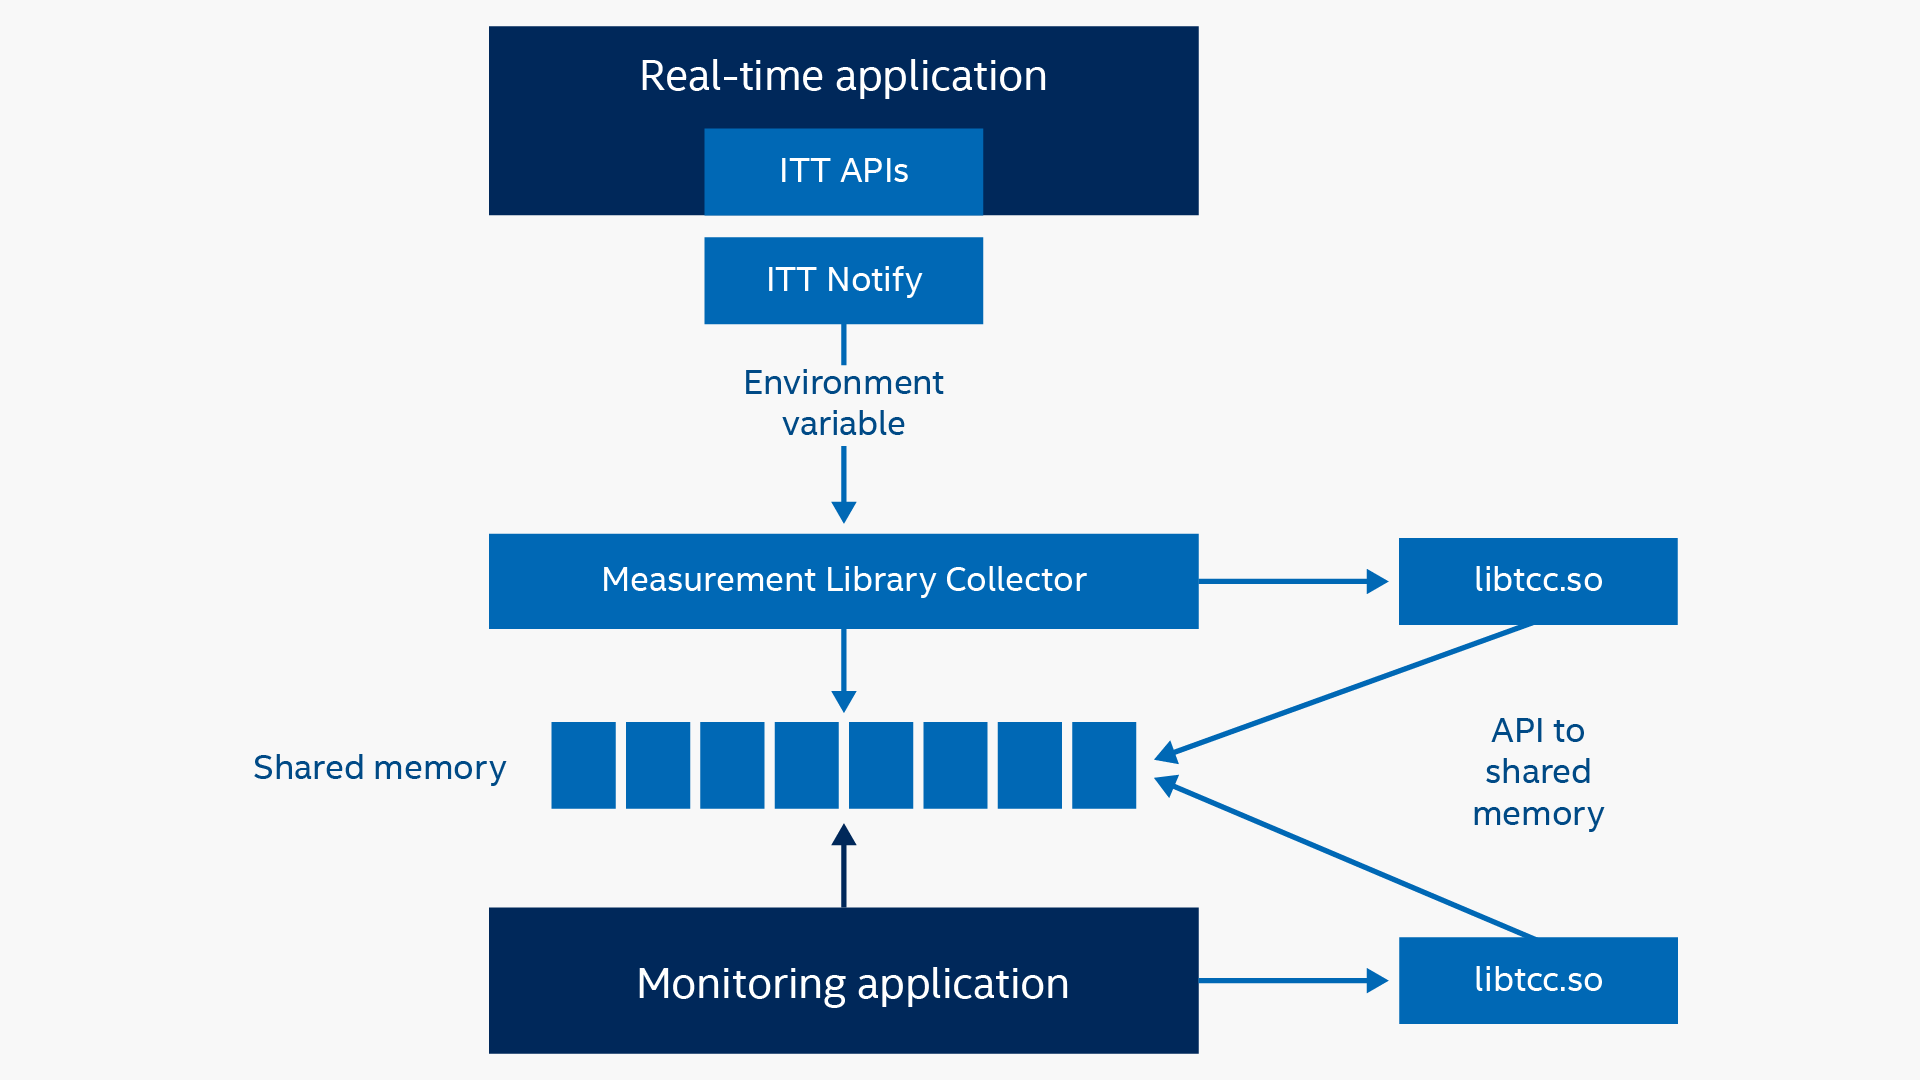
Conversely, developers can use a monitoring application running concurrently with the real-time application to track measurements and perform actions in real time based on those measurements. This is valuable when users are monitoring the real-time application over a long period but need to store more measurement data than the capacity of the buffer or the real-time application.
A monitoring application runs on a non-real-time core, providing flexibility for storing, writing, sending, or otherwise manipulating the data by accessing the same shared memory buffer as the real-time applications through a set of APIs.
To accelerate the real-time development process, the measurement library includes many code samples that can be customized for an organization’s specific needs, such as creating histograms from multiple measurements:
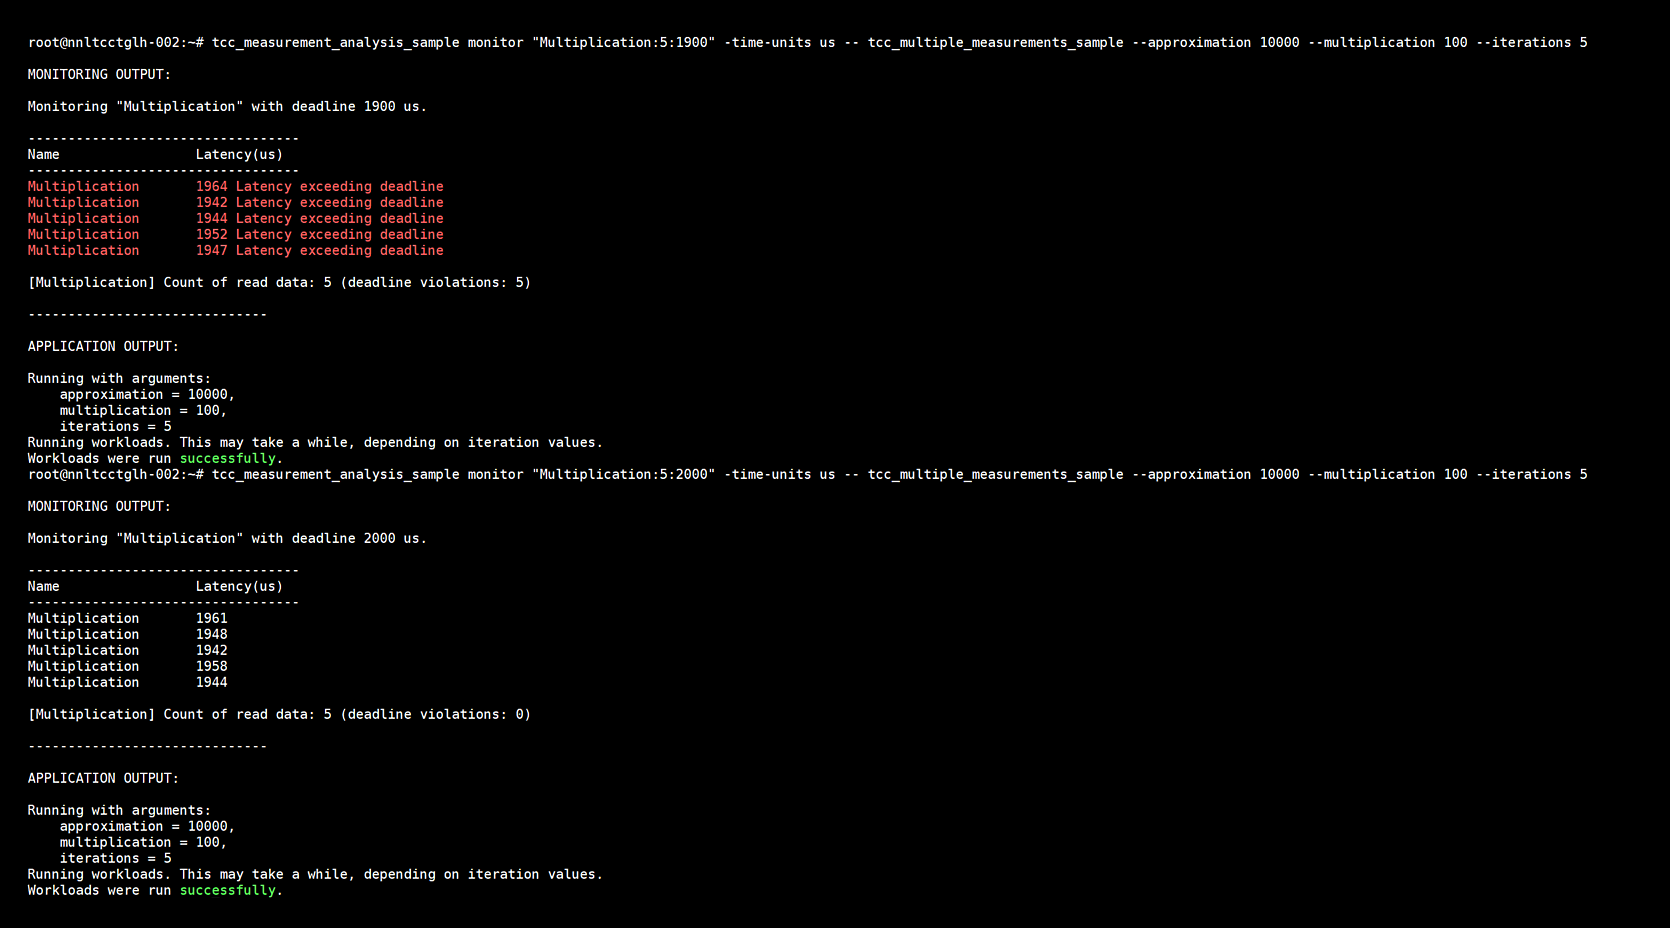
Another useful sample demonstrates setting a timing deadline and knowing when it is violated.
After instrumenting code with the measurement library, developers can further visualize the results or do more analysis on the sequence and duration of tasks using VTune Profiler. You can see a walkthrough of how to do this here.