ABSTRACT
Intel® System Debugger is a debugging tool kit which is part of Intel® System Studio. ISD is composed by tree debugging tools: System Debug, System Trace, and Intel® Debug Extensions for WinDbg* (Windows* only). This WinDbg* extension is an extension for the Microsoft* WinDbg*. The original WinDbg has to work with Windows* debug drivers. But in some system hang cases, the debug driver is also not working. The normal WinDbg* can't output anything. This extension tool changes the debugging route to Intel® Direct Connect Interface (DCI). So, when the OS malfunctions, we can expect WinDbg* with DCI's help still can send out some information for debugging. In this article, we will show readers how to use this tool when soft-hang issue happens.
Soft-Hang Issues
Before we start learning how to use the Intel® Debugger Extension for WinDbg, we need to understand when is the right time to use this tool. When the Windows* operating system(OS) hangs without auto-repairing nor getting into blue screen (BSOD), a user should see the screen freezing and the OS not responding. Or even worse, it shows a black screen and Ctrl+Alt+Del doesn't work. In this circumstance, if CPU is malfunction as well, we can treat it as a hard-hang. Contrarily, if CPU is still running, it's called a soft-hang. When this soft-hang issue happens, the software engineer may try using the traditional WinDbg* first for debugging. But usually the Windows debug driver doesn't work and he or she cannot make a WinDbg* connection in this situation. That is the reason why Intel provides another debug solution - Intel® Debug Extensions for WinDbg*.
Intel® Debugger Extension for WinDbg*
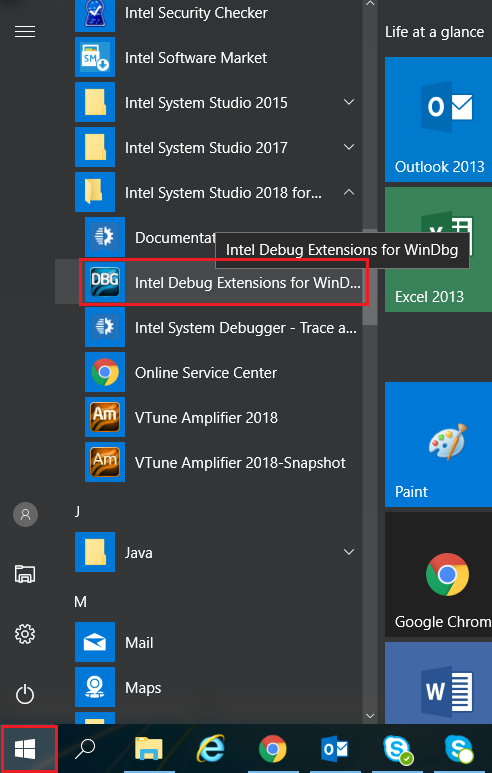
In Intel® System Studio, the user needs to configure the target platform and probe in Target Connection Agent (TCA) before using Intel® Debug Extensions for WinDbg. When the TCA setting is complete, the user can launch Intel® Debugger Extension for WinDbg* by clicking the shortcut in Windows Start Menu.
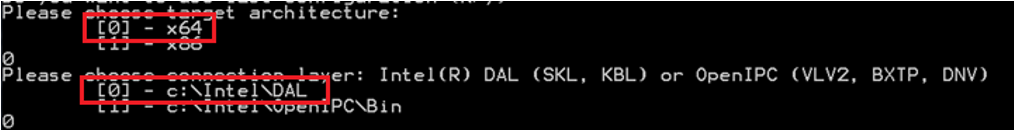
Then, the user has to configure the connection engine again in a console view. We have two engines that help to establish a connection between host and target. DAL is for big-core chipsets such as 6th generation Intel® Core™ processors and Intel® Core™ i7 processors. OpenIPC is for small-core chipsets such as Intel Atom® processors, Intel® Pentium® processors, Intel® Celeron® processors, and Intel Atom® processors c3. For example, if the target platform is a 64-bit Intel Core i7 processor, enter the numbers as follows:
Once the connection is created, two more commands are required to launch the WinDbg. The first command "wdbg = itpkd.WindbgShell() is for initializing the WinDbg* session.
There are some requirements need to be satisfied before running wdbg = itpkd.WindbgShell()
- The target is in Windows* or pre-Windows phase
- The CPU on target platform is able to halt
- Windows* Driver Kit* (WDK) 10* is installed on host
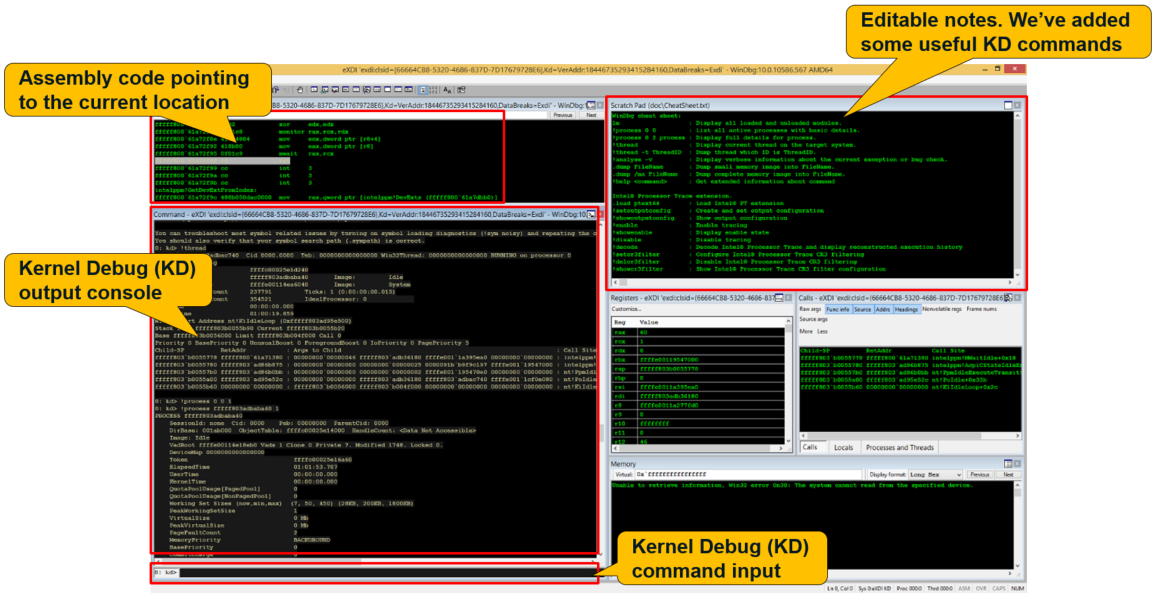
If there's no error message after the command, the last step is entering the command wdbg.run(). Then, the user should be able to see the WinDbg on screen. The Intel® Debug Extensions for WinDbg uses customized Microsoft WinDbg as the Graphics User Interface(GUI). It includes assembly view showing the current process. Kernel Debug(KD) output console shows the result for commands input in the bottom KD command input field. There is a cheat sheet recommend commands that users can try for debugging. And it shows the content of memory and registers.