Gain Insights into How Well Your Application Is Vectorized Using Intel® Advisor
Kevin O’Leary, technical consulting engineer, Intel Corporation
@IntelDevTools
Get the Latest on All Things CODE
Sign Up
Determining how well your application is vectorized is crucial to getting the best performance on your system. In this article, you'll:
- Learn to pinpoint vectorization issues.
- See how well you’re using hardware.
- Optimize performance using Intel® Advisor, which is available in a free, stand-alone version and as part of the Intel® oneAPI Base Toolkit.
Intel Advisor helps you to see:
- Which loops are vectorized
- Data types, vector widths, and instruction sets such as Intel® Advanced Vector Extensions 512 (Intel® AVX-512) and Intel® Advanced Vector Extensions 2
- How many floating-point and integer operations are running
- Number of instructions devoted to computation and how many to memory operations
- Your register use
- Ways to improve your vectorization
- And much more
Get Great Performance
To get top performance out of an application, you need information on how well you’re using all of the system resources. The improved summary view in Intel Advisor (Figure 1) indicates how well the application is performing as a whole.
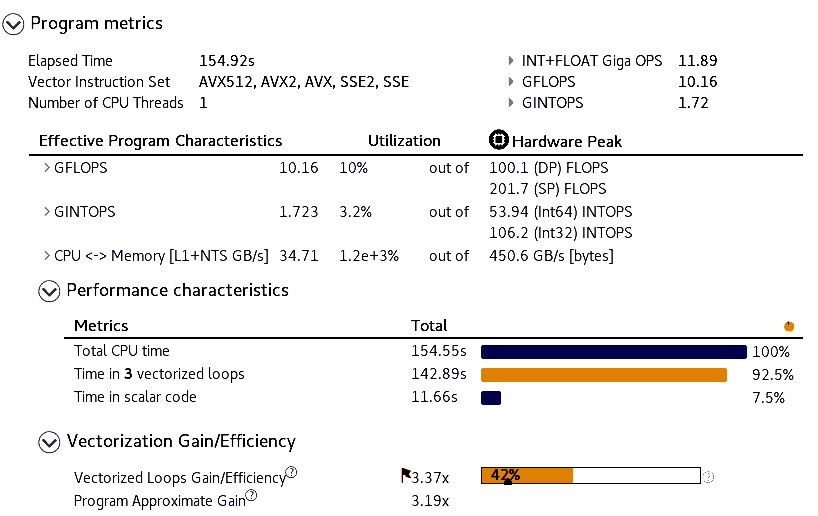
Figure 1. Intel Advisor summary view
You can see the vectorization instruction sets used and some useful performance metrics. This view includes a program characteristics section that compares relative performance to the peak performance obtainable on your system. In Figure 1, notice that the application is using several different instruction sets―something to investigate. The program is also getting vectorization efficiency of just 42%. Where was 58% of the efficiency lost? You can get more details to investigate.
Access More Details
Get more detail in the Survey & Roofline tab (Figure 2). The survey view gives details on a loop-by-loop basis. Focus on the loops where you’re spending the most time, and try to get these loops to vectorize as efficiently as possible. Intel Advisor highlights whether the loop is vectorized and its efficiency. If the compiler wasn’t able to vectorize the loop, Intel Advisor can tell you why. The Performance Issues column can give you clues as to why efficiency is poor.
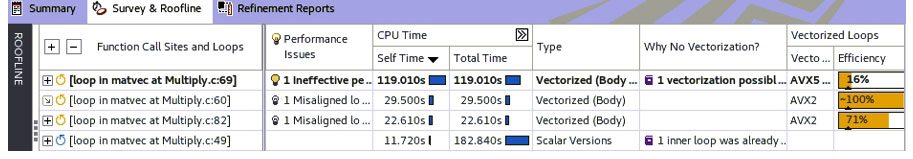
Figure 2. Survey & Rooftop tab
Instruction Set Analysis
Instruction set analysis (Figure 3) provides more information for what the compiler did to vectorize your code. It shows the:
- Vectorization instruction set used
- Vector widths
- Data type being operated on
The Traits column generally indicates the memory manipulation the compiler had to do to fit the data structure into a vector. These memory manipulations can be indicators of poor efficiency.
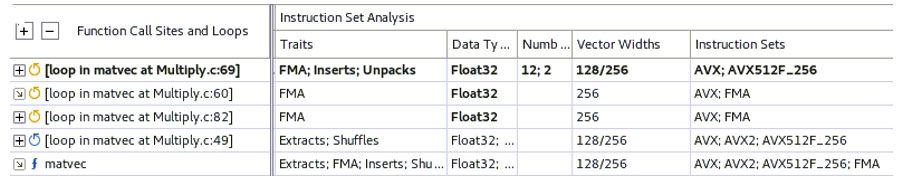
Figure 3. Instruction set analysis
In the example application, the main loop is using Intel® AVX-512, but the vector widths are only 128 and 256. Also, Intel Advisor gives a warning message if your application seems to be underperforming and offers tuning advice (Figure 4).

Figure 4. Warning message
Recompiling to enable the ZMM registers yields the instruction set analysis in Figure 5. Most of our loops now use the complete 512 bytes of the vector registers. In our example, using the ZMM registers improved performance. However, this isn’t always the case. It’s application-specific.
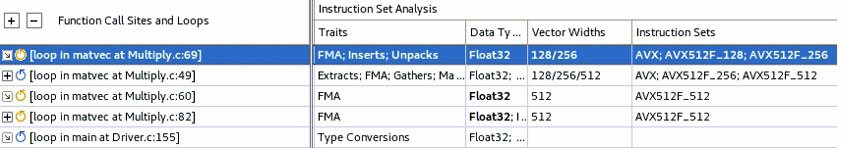
Figure 5. Instruction set analysis
Using the Middle Part of the Intel Advisor GUI
The tabs in the middle of the Intel Advisor GUI contain a wealth of program information (Figure 6).

Figure 6. Intel Advisor GUI tabs
The Recommendations tab provides tips to improve performance (Figure 7). For instance, if a loop didn’t vectorize, the Vectorization tab provides information for why this happened, along with providing code examples showing how to fix the issue.
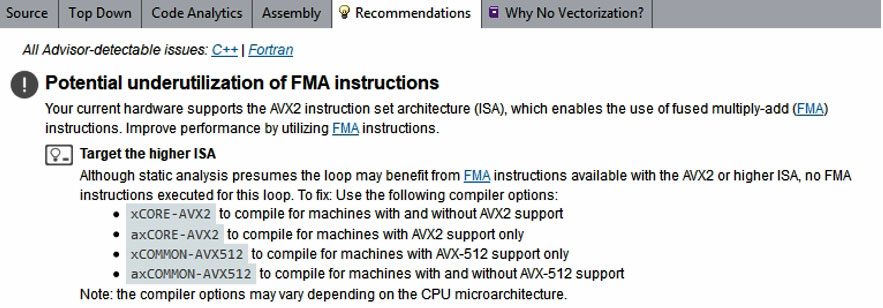
Figure 7. Intel Advisor Recommendations tab
Code Analytics
The Code Analytics tab (Figure 8) gives details about what’s happening in a loop. You can see the performance at a high level or get statistics for all operations and an instruction mix summary.
Figure 8. Intel Advisor Code Analytics tab
Statistics for All Operations
This section includes floating-point operations per second (FLOPS), integer operations (INTOP), or mixed (INT+FLOAT) operations (Figure 9). This gives you a detailed view of some key performance metrics, showing how many instructions are running per second. This view also gives metrics on how well you’re using the memory hierarchy in this loop.
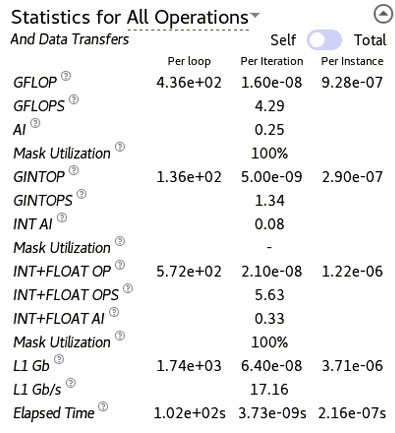
Figure 9. Statistics for All Operations section
How Many Operations Are You Running?
What are the types of instructions in your loop? Are they compute or memory based? Intel Advisor can answer these questions, and give the static and dynamic instruction count with the static instruction mix summary (Figure 10). Get the percentage of each running instruction to see if the newest instructions are used where they should be.
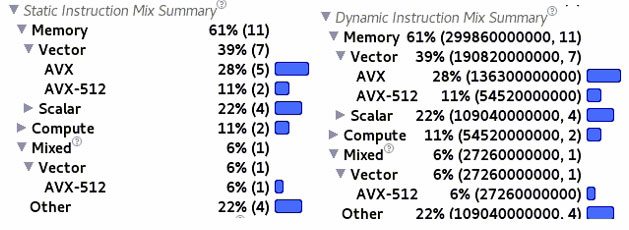
Figure 10. Static instruction mix summary
Optimize Vectorization
It’s crucial to optimize the vectorization of your program. Understanding how well your program is vectorized by using a tool like Intel Advisor can help ensure you’re getting the most out of your hardware.
______
You May Also Like
Extending the Roofline Model
Listen
Intel® Advisor
Design code for efficient vectorization, threading, memory usage, and GPU offloading.
Intel Advisor is included as part of the Intel® oneAPI Base Toolkit.