In 2006, the University of California at Berkeley Parallel Computing Laboratory suggested that widespread adoption of parallel processing required greater separation of concerns between domain experts and tuning experts.1 Separation of concerns is a spectrum (Figure 1). On the one hand, you have users who are just trying to solve a problem. They can be from any field and their formal computing training varies. They really just want to do the least amount of coding required to get an answer so that they can move on to the larger task that they’re trying to complete, whether it’s a business decision, research article, engineering design, etc. Code tuning is only considered when the performance bottleneck prevents them from reaching this goal. At the other extreme are tuning experts (often referred to internally as ninja programmers) intent on squeezing every ounce of performance from a piece of code whose role in the larger application is unimportant.

Figure 1. Separation of concerns is a spectrum. Most computational scientists are between the extremes. Programming tools help close the gap.
Most of us exist somewhere between these extremes. Personally, I started at the domain expert side of the spectrum. I wanted to stay there but I gradually had to move to the middle because poor application performance started to limit my research.
True separation of concerns requires frameworks and abstractions that allow domain experts to focus on solving their problems without sacrificing compute performance. For example, I know how to apply the Fast Fourier Transform in my scientific domain, but I would never dream of writing an FFT myself because experts have already done it for me. I can just use their libraries to get all the benefit of their expertise. Math libraries are an obvious example of separation of concerns in action. They bridge the gap between domain experts and tuning experts.
Profiling tools are another way to bridge this gap, as long as they provide information that domain experts can actually use. I once evaluated a programming tool that gathered reams of performance data for my application and displayed it concisely. At first, I was enthralled by the colorful GUI and the amount of data at my disposal—but when the novelty wore off, I realized that none of the data was actionable or otherwise helpful in tuning my application. Profilers are typically developed by tuning experts, but to be effective they must encapsulate tuning expertise and present it in a manner that domain experts can understand.
Intel® Parallel Studio XE is a suite of tools that provide actionable advice to developers, whether for debugging or tuning. Its workhorse profiler, Intel® VTune™ Amplifier, gathers a ton of performance data while an application is running. The data are stored in a database, and tuning experts actually prefer to read it in tabular form. The rest of us prefer a summary so Intel Parallel Studio XE contains analyzers that aggregate and summarize the profiling data to make it more accessible. For example, the roofline analysis in Intel® Advisor provides a graphical summary of an application’s memory access efficiency (Figure 1). The glaring red dot indicates a section of code that is hurting performance. Clicking on this dot opens a source code window that provides additional information in plain language (Figure 2). As the name implies, Intel Advisor provides tuning advice. In Figure 2, it is telling the programmer that vectorizing the performance-critical loop should boost performance.2
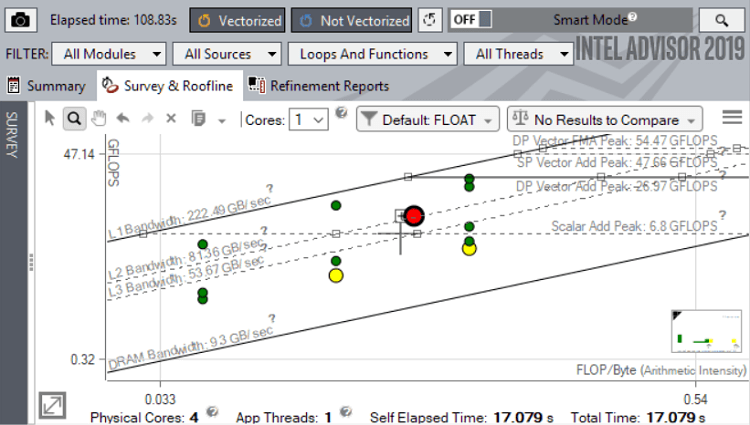
Figure 2. Cache-aware roofline analysis from Intel Advisor

Figure 3. Intel Advisor source view
The Intel VTune Amplifier Application Performance Snapshot takes the trend even further toward aggregation and summarization. It packs a lot of performance data into a single graphical snapshot (Figure 3).3 Notice that the blue box in the upper right explicitly states the most critical performance issue – the application is memory bound—and then recommends the tools to dig deeper into the problem. The advice is drawn from the other performance data in the snapshot, like memory stalls and floating-point unit (FPU) utilization, but other performance problems like the OpenMP* load imbalance are also highlighted.


Figure 4. Intel VTune Amplifier Application Performance Snapshot
In terms of separation of concerns, the snapshot encapsulates the tuning expertise of the tool’s developers and presents it to the application developer. For example, the target column in the blue box provides thresholds for each performance metric. This lets the developer know how far off the mark the application is in terms of best possible performance. Just as importantly, it helps the developer know when to stop tuning. After a certain point, further tuning yields diminishing returns. But without sufficient experience, it's hard to know when this point is reached. The tool is helping to bridge the gap between tuning experts and domain experts.
References
- Asanovic et al., The Landscape of Parallel Computing Research: A View
- See Intel® Advisor Roofline Analysis (The Parallel Universe, Issue 27) for a detailed look at the roofline analysis technique.
- See Code Modernization in Action (The Parallel Universe, Issue 33) for a step-by-step demonstration of the Application Performance Snapshot feature.
About the Author
 Henry A. Gabb, Senior Principal Engineer at Intel Corporation, is a longtime high-performance and parallel computing practitioner. He has published numerous articles on parallel programming, computational life science, and cheminformatics. Henry is the editor of The Parallel Universe, Intel’s quarterly magazine devoted to software innovation. He was also editor and coauthor of Developing Multithreaded Applications: A Platform Consistent Approach and was the program manager of the Intel/Microsoft Universal Parallel Computing Research Centers.