Marcelo Pinheiro, PhD - Principal Engineer - Intel Architecture Graphics and Software (IAGS) Division - Microsoft Technology Center
Dhvani Chheda, M.Sc. – Cloud Software Engineer – Intel Architecture Graphics and Software (IAGS) Division - Microsoft Technology Center
Contributors – Rajeev Nalawadi, Padma Apparao, Lokendra Uppuluri
SUMMARY
Microsoft Azure* Stack HCI cloud solutions provide a hyper-converged infrastructure (HCI) that allows end-customers to run workloads on premises or in the cloud. It is a full software and hardware stack to manage a combination of compute, network and storage. This study describes AI Inferencing workload performance benefits and characteristics when utilizing Intel® Deep Learning Boost technology on Azure Stack HCI. The Intel Deep Learning Boost technology is available in 2nd generation Intel® Xeon® Scalable Processors, and provides AI inference acceleration while still taking advantage of failover clustering and live migration features on Azure Stack HCI. The objective of this study is to enable IT architects and system administrators to develop infrastructure and deployment strategies to optimize AI inference workloads with Intel Deep Learning Boost technology. This study will highlight optimizations that can be found through the use of CPU groups and minroot isolation while running multiple VM instances doing AI inferencing or in a mixed workload scenarios.
Overview
There is exponential growth in the digital world regarding the amount of data generated and consumed by enterprises, governments and the general public. There is a growing need to be able to transform raw untreated data into meaningful and relevant information. This empowers executives, leader and automated systems to make more accurate and timely decisions. All of these factors are driving increased need and use of artificial intelligence, both in the cloud and on premises. Using pre-trained models from a public GitHub* repository [12], this article will show how to optimize your Azure Stack HCI hybrid cloud for Intel Deep Learning Boost Technology.
This study shares the lessons learned in preparing Microsoft Azure Stack HCI (ASHCI) hybrid cloud infrastructure to run AI inferencing models using Intel Deep Learning Boost technology [23][24]. We will provide insights of the selected workload stack, explain its behavior and its impact on the key building blocks of ASHCI environment. When carefully planned and executed, Deep Learning models can run on your hybrid cloud with the performance agility to address the full breadth of customers’ evolving workload requirements. After reading this study, you will understand:
-
Intel Deep Learning Boost technology
-
Workload characterization for selected Image Classification models
-
Hyper-V behavior with mixed workloads (inferencing and storage microbenchmark)
This study is NOT about:
-
Step-by-step on how to set up Microsoft Azure Stack HCI
-
Performance or benchmark tests for any workload. For any performance and/or benchmarking information on specific Intel platforms, please visit https://www.intel.ai/blogs.
-
Claiming that all AI inferencing will have the same behavior or characteristics.
-
Claiming that all mixed workload scenarios in Azure Stack HCI will have a similar behavior.
Intel Deep Learning (DL) Boost Technology
Intel DL Boost technology is an innovation based on the Intel® Advanced Vector Extensions 512 engine and it contains Vector Neural Network Instructions (VNNI) to deliver performance improvements by creating a new instruction that is a combination of previous three. This unique built-in AI accelerator on 2nd Generation Intel® Xeon Scalable Processors maximizes the use of compute resources and improves cache and memory bandwidth utilization.
AVX are a set of instructions that operate on different register lengths that are designed to improve workload parallelization – SIMD (Single Instruction Multiple Data). With the Intel AVX-512 and Intel DL Boost technologies, it has continued to propel workload optimization innovations for developers over the years [5],[6].
Figure 1 depicts the evolution of Intel instructions set to support VNNI operations.
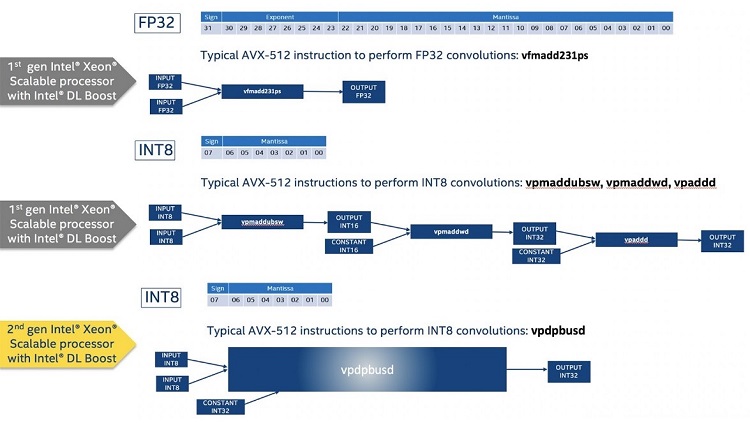
Figure 1: Intel Deep Learning Boost instruction
One major difference is that it uses INT8 instead of FP32 data type. For more details about Intel Deep Learning Boost (VNNI) and its internal operations, precision, and differences between INT8 and FP32, please refer to [1], [2] and [3].
AVX register lengths are 256-bit and 512-bit [18][19]. Depending on the instruction generated by the workload/application, the Intel CPU cores have three license modes which are directly related to the frequency that they operate. The higher the register length, the lower the clock frequency on the core. So, when an AVX-512 instruction that leverages 512-bit registers is executed, the corresponding cores will operate at a different base frequency and will have a different max frequency. Intel publishes specifications containing these details for every CPU generation. The examples below were extracted from [7]. Figures 2, 3, and 4 show the differences in base frequency and max frequency based on the number of active cores for non-AVX, AVX 2.0 and AVX-512.
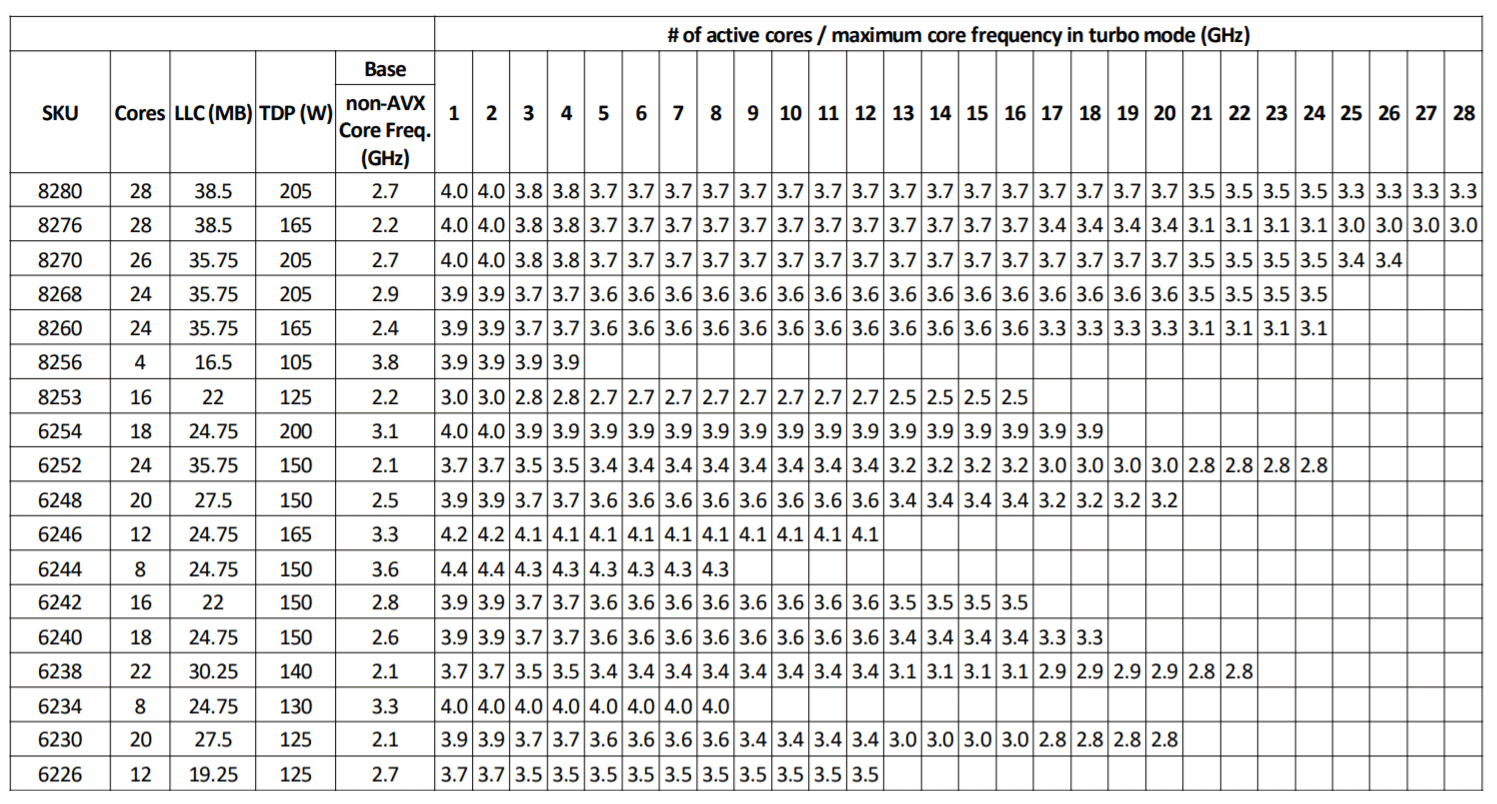
Figure 2: Second Generation Intel® Xeon® Scalable Processors Non-AVX Turbo Frequencies

Figure 3: Second Generation Intel Xeon Scalable Processors AVX2.0 Turbo Frequencies

Figure 4: Second Generation Intel Xeon Scalable Processors AVX-512 Turbo Frequencies
There are two aspects on how to use Intel Deep Learning Boost technology: the OS and virtualization support and your application.
From an infrastructure perspective, Intel Deep Learning Boost technology is enabled by default on Windows* Server 2019 Hyper-V*. If you are using Intel Second Generation Xeon Scalable Processor with Windows Server 2019, there is no specific action to perform from an infrastructure perspective. It is automatically available for all VMs.
From your application perspective, you can start using the models from the public Github repository [12] or if you are a developer or simply interested in learning more about the application code details and Intel instruction set, please refer to this article [13] or visit the Intel® AI Developer Program [14].
Software and Hardware Configuration
Microsoft Azure Stack HCI has a rich solutions catalog with available solutions from multiple OEMs that you can leverage [22]. The configuration below is one recommendation. However, many are available from your OEM of choice. You can select a certified solution from the ASHCI catalog.
Hardware
All hardware components listed below are certified. Our testing utilized Intel Server Systems and Intel storage devices. Table 1 shows a reference hardware configuration that you can use to set up your Azure Stack HCI cluster setup.
|
|
Quantity |
|
|---|---|---|
| Platform |
Intel® WolfPass 2U (Board: S2600WFT) |
1 |
| Processor |
Second Generation Intel Xeon Scalable Processor 6230 (2 Sockets, 20 Cores, Base Frequency 2.10GHz) |
2 |
| Memory |
32GB DDR4 2666 MHz |
8 |
| Network Adapter |
Intel® Ethernet Connection X722 for 10GbE SFP+ |
1 |
| Boot Device |
Intel® SSD DC S4510 Series 960GB |
1 |
| Cache |
Intel® SSD DC P4610 Series 1.6TB |
2 |
| Capacity |
Intel® SSD DC S4510 Series 960GB |
22 |
Table1: A Hardware configuration for each node in Azure Stack HCI cluster
Software Stack
Microsoft Azure Stack HCI is built on top of Microsoft-validated hardware running Windows Server 2019 cluster services that allow you to run virtualized workloads on-premises. Additionally, and optionally, it can connect your on-premises software stack to Azure services for cloud-based backup, site-recovery, and more.
Azure Stack HCI is a solution that combines several products:
-
OEM ASHCI Validated Hardware
-
Windows Server 2019 Datacenter edition
-
Windows Admin Center
-
Azure services (optional)
For more details on Azure Stack HCI, please visit:
-
Azure Stack HCI Architecture

Figure 5: Azure Stack HCI Solution
Overall hardware and software configuration
This section describes the hardware and software set up used for our experiments.
BIOS set up:
| BIOS setting |
|
|---|---|
| BIOS Version |
SE5C620.86B.02.01.0012.070720200218, 7/7/2020 |
| Virtualization (VT) |
Enabled |
| Hyper-Threading (HT) |
Enabled (resulting in 80 LPs in total) |
| VT-d I/O |
Enabled |
| CPU Power and Performance |
Performance |
| Package C-State |
C0/C1 state |
Table 2: BIOS settings
Azure Stack Set up:
| OS settings |
|
|---|---|
| OS Build |
17763.1397 |
| Security mitigations |
Enabled [17] |
| Guest SMT |
Enabled |
| Hyper-V Scheduler |
Core |
| Power Plan |
High Performance |
| Software Defined Storage |
|
| Resiliency |
3-way mirror |
| CSV volumes |
4 5TB volumes (1 per node) |
| In-memory CSV cache |
Disabled |
| VM Autobalancer |
Disabled |
| CSV Balancer |
Disabled |
| Network |
|
| Net Qos Flow Control |
Enabled – Priority class 3 defined for Storage |
| RDMA |
Enabled |
| Jumbo Frames |
9014 bytes |
| Datacenter Bridging |
Enabled |
| Enhanced Traffic Shaping |
50% reserved for Storage traffic class (Priority 3) |
| Top of Rack (TOR) Switches |
2x Arista DCS-7050SX2-72Q-R |
| Management Switch |
1x Arista DCS-7010T-48-R |
Table 3: Azure Stack HCI cluster settings
| Performance Tools |
Links |
|---|---|
| Perfmon (Microsoft Windows Performance Monitor) |
|
| Emon (Event Monitoring tool from Intel) |
|
| Intel® VTune Profiler |
Table 4: Performance Monitoring Tools
Workload Characteristics and Experiment Setup
There are multiple use cases for deep learning such as video surveillance, voice/speech recognition, querying image content, medical image analysis, patient data processing, book/music/movies recommendation, etc. For the purpose of this study we will explore Resnet50, a 50-layer deep residual network used for image classification. It is a sub class of convolutional neural networks. We used a publicly available Resnet50 model that is trained with the TensorFlow* framework and the Intel Deep Neural Network Library (DNNL) execution provider. The experiments and data shown use synthetic data generated by the workload. Using synthetic data does not allow for accuracy calculation, however, Intel Deep Learning Boost accuracy loss is minimal when comparing INT8 to FP32 data format [3]. The workload supports the calculation of accuracy by using a dataset with real images. For more information on the workload, please refer to [8].
Following are some of the parameters used in the workload:
-
Batch size – the number of input images processed per iteration. We experimented with different batch sizes and fixed a batch size of 32 for the data shown ahead.
-
Kmp_affinity – granularity=fine,verbose,compact,1,0 – this is an environment variable used to bind OpenMP threads to physical processing units. The setting mentioned above binds consecutive threads to separate physical cores and once each core has been assigned it starts assigning threads to the available processors in the same order.
-
Input data shape – [32,224,224,3] – batch size 32, 224x224 pixels image size, 3 RGB channels
-
Num_inter_threads – number of operations that can be executed in parallel. Set to 1 by default.
-
Num_intra_threads – number of threads used to parallelize execution within an operation. Set to 10 for a 20VP VM.
This experiment creates a Linux virtual machine (Ubuntu* 20.04) with 20 virtual processors (VPs) and 40GB memory on one of the 4 nodes of the Azure Stack HCI cluster. Since Resnet50 is a compute intensive workload, we chose 20 VPs as the size of the VM which represents about 25% of the compute resources on the host node (80 logical processors (LPs) in total). The virtual machine has a Docker* container running the workload leveraging the TensorFlow framework.
Hyper-V CPU Groups
This section indicates the throughput (in images/sec) and average time per iteration observed with 1 VM running the Resnet50 workload (batch size 32) and then with 4VMs running the workload simultaneously. In the latter case, the throughput does not scale linearly with the number of VMs because of an increase in virtual processor to logical processor migrations. The usage of CPU groups to achieve throughput improvement in that case is highlighted below.
Table 5 shows the first set of runs taken with 1VM running the resnet50 workload with a batch size of 32 using int8 models with relevant counters highlighted.
| Metrics |
Resnet50 - 1VM (20VPs,40GB) – Batch Size 32 |
||
|---|---|---|---|
|
|
Run 1 |
Run 2 |
Run3 |
| Avg time / iteration (s) |
0.089 |
0.088 |
0.087 |
| Images processed / sec |
359 |
361 |
367 |
|
|
|||
| AVX -512 license % |
74.68 |
74.45 |
74.56 |
|
|
|||
| LP total run time % |
14.7 |
14.47 |
14.85 |
| VP total run time % |
48.96 |
48.86 |
49.27 |
| Root VP total run time % |
1.91 |
2.06 |
1.95 |
|
|
|||
| Total memory bandwidth (GBps) |
12.19 |
12.02 |
11.88 |
| Local DRAM reads % |
99.32 |
98.93 |
99.38 |
|
|
|||
| LP migrations/sec |
419.52 |
425.29 |
414.41 |
Table 5: 1VM Resnet50 and infrastructure selected performance metrics LP -logical processor, VP – virtual processor
As highlighted above, the average time per iteration and average throughput across 3 runs is 0.088 seconds and 362 images/second. The AVX-512 license % determines the percentage of time spent executing AVX-512 instructions in L2 mode. There are 3 different license modes – L0, L1 and L2 representing different levels of frequency down-clocking based on the kind of AVX-512 usage. The average AVX-512 license % is 74.56% which indicates significant AVX-512 usage in the workload, which is expected. The Turbo power setting in the BIOS was kept OFF in order to reduce run-to-run variance.
The logical processor (LP) run time represents the physical CPU usage which is about 14.67%. The average virtual processor (VP) total run time is 49.03% which indicates that half of the VPs are utilized. This is an intentional setting in the workload to use only one thread on each physical core. The workload benefits from less resource contention between two active threads on the same core. The root VP run time is minimal as there is negligible I/O activity.
The memory bandwidth driven by the workload is 12.03 GBps on an average. The average local DRAM reads % is 99.21% which indicates that most of the memory reads are from the local NUMA node. When the local DRAM reads % reduces and memory reads occur from the remote NUMA node, it increases latency and affects performance.
An interesting counter to check is the VP to LP migrations per second which is significantly high. In order to illustrate the impact of these migrations and the usage of CPU groups to alleviate it, we ran the workload on 4 VMs with the same configuration simultaneously. The 4 VMs (with 80 VPs in total) are hosted on one of the four nodes of the cluster resulting in equal subscription on that node.
| Metrics |
4VMs (20VPs,40GB each) – Batch Size 32 |
|
|---|---|---|
|
|
no CPU groups |
CPU groups |
| Avg time / iteration (s) |
0.098 |
0.095 |
| Total Images processed / sec (for 4VMs) |
1253 |
1342 |
|
|
||
| AVX -512 license % |
82.24 |
84.14 |
|
|
||
| LP total run time % |
47.53 |
50.79 |
| VP total run time % |
45.23 |
48.41 |
| Root VP total run time % |
1.81 |
1.87 |
|
|
||
| total memory bandwidth (GBps) |
50.15 |
54.33 |
| Local DRAM reads % |
98.62 |
99.79 |
|
|
||
| LP migrations/sec |
1,983.94 |
1,398.28 |
Table 6: Comparing the effect of CPU groups for 4 Resnet50 Virtual Machines in a single node
The total throughput in terms of images/sec observed for 4 VMs is shown in the table above. CPU groups is a Windows feature that allows pinning a group of virtual processors to a group of logical processors on the physical server [10]. For example, in this case there were 4 CPU groups of 20 LPs each assigning one group to each of the 4 VMs. The VMs would only run on the specific group of 20 LPs assigned to them.
The VP to LP migrations reduce by 29.52% resulting in a throughput improvement of 7.1%. This proves CPU groups to be a good performance tuning parameter when there are multiple virtual machines running Resnet50 simultaneously.
The VP to LP migrations do not reduce to 0 with the usage of CPU groups because there are still migrations happening within the VM. Thus, the benefit of CPU groups is not as apparent in the case of only 1VM running the workload.
As a side note, CPU groups are configured per node, and if the VM is live migrated to a node that does not have CPU groups, it will not be affinitized to any group. When the VM returns to its original node with CPU groups configured, it will be part of the CPU group again automatically. For consistency, we strongly recommend creating and managing CPU groups in all nodes in the cluster.
Configuration of CPU groups must be carefully planned to avoid any unexpected behavior. Before applying CPU groups into production, it is strongly recommended to validate the same in a non-production environment.
AVX-512 Frequency Impact
The clock frequency on cores is dynamically reduced when 512-bit instructions are executed. The cores can run in 3 different modes – license 0 (L0), license 1 (L1) and license 2 (L2). License 0 mode has the fastest clock frequency, license 1 is slower and license 2 is the slowest. AVX-512 instructions utilized in a sustained manner result in the cores going into L2 mode.
To illustrate the expected frequency reduction as a result of AVX-512, we conducted an experiment where we ran Resnet50 on a VM (20 VPs) which was pinned to the last 20 LPs of socket 1 using CPU groups. Simultaneously, we ran a storage intensive microbenchmark, Diskspd, on 15 VMs of 4 VPs affintized to the rest of the 60 cores spanning both the sockets (10 VMs on socket 0 and 5VMs on socket 1).
The Turbo power setting in the BIOS was kept ON for this experiment in order to illustrate the difference between the frequencies on the cores running Diskspd versus Resnet50.
The following diagram shows the core frequency on socket 1:
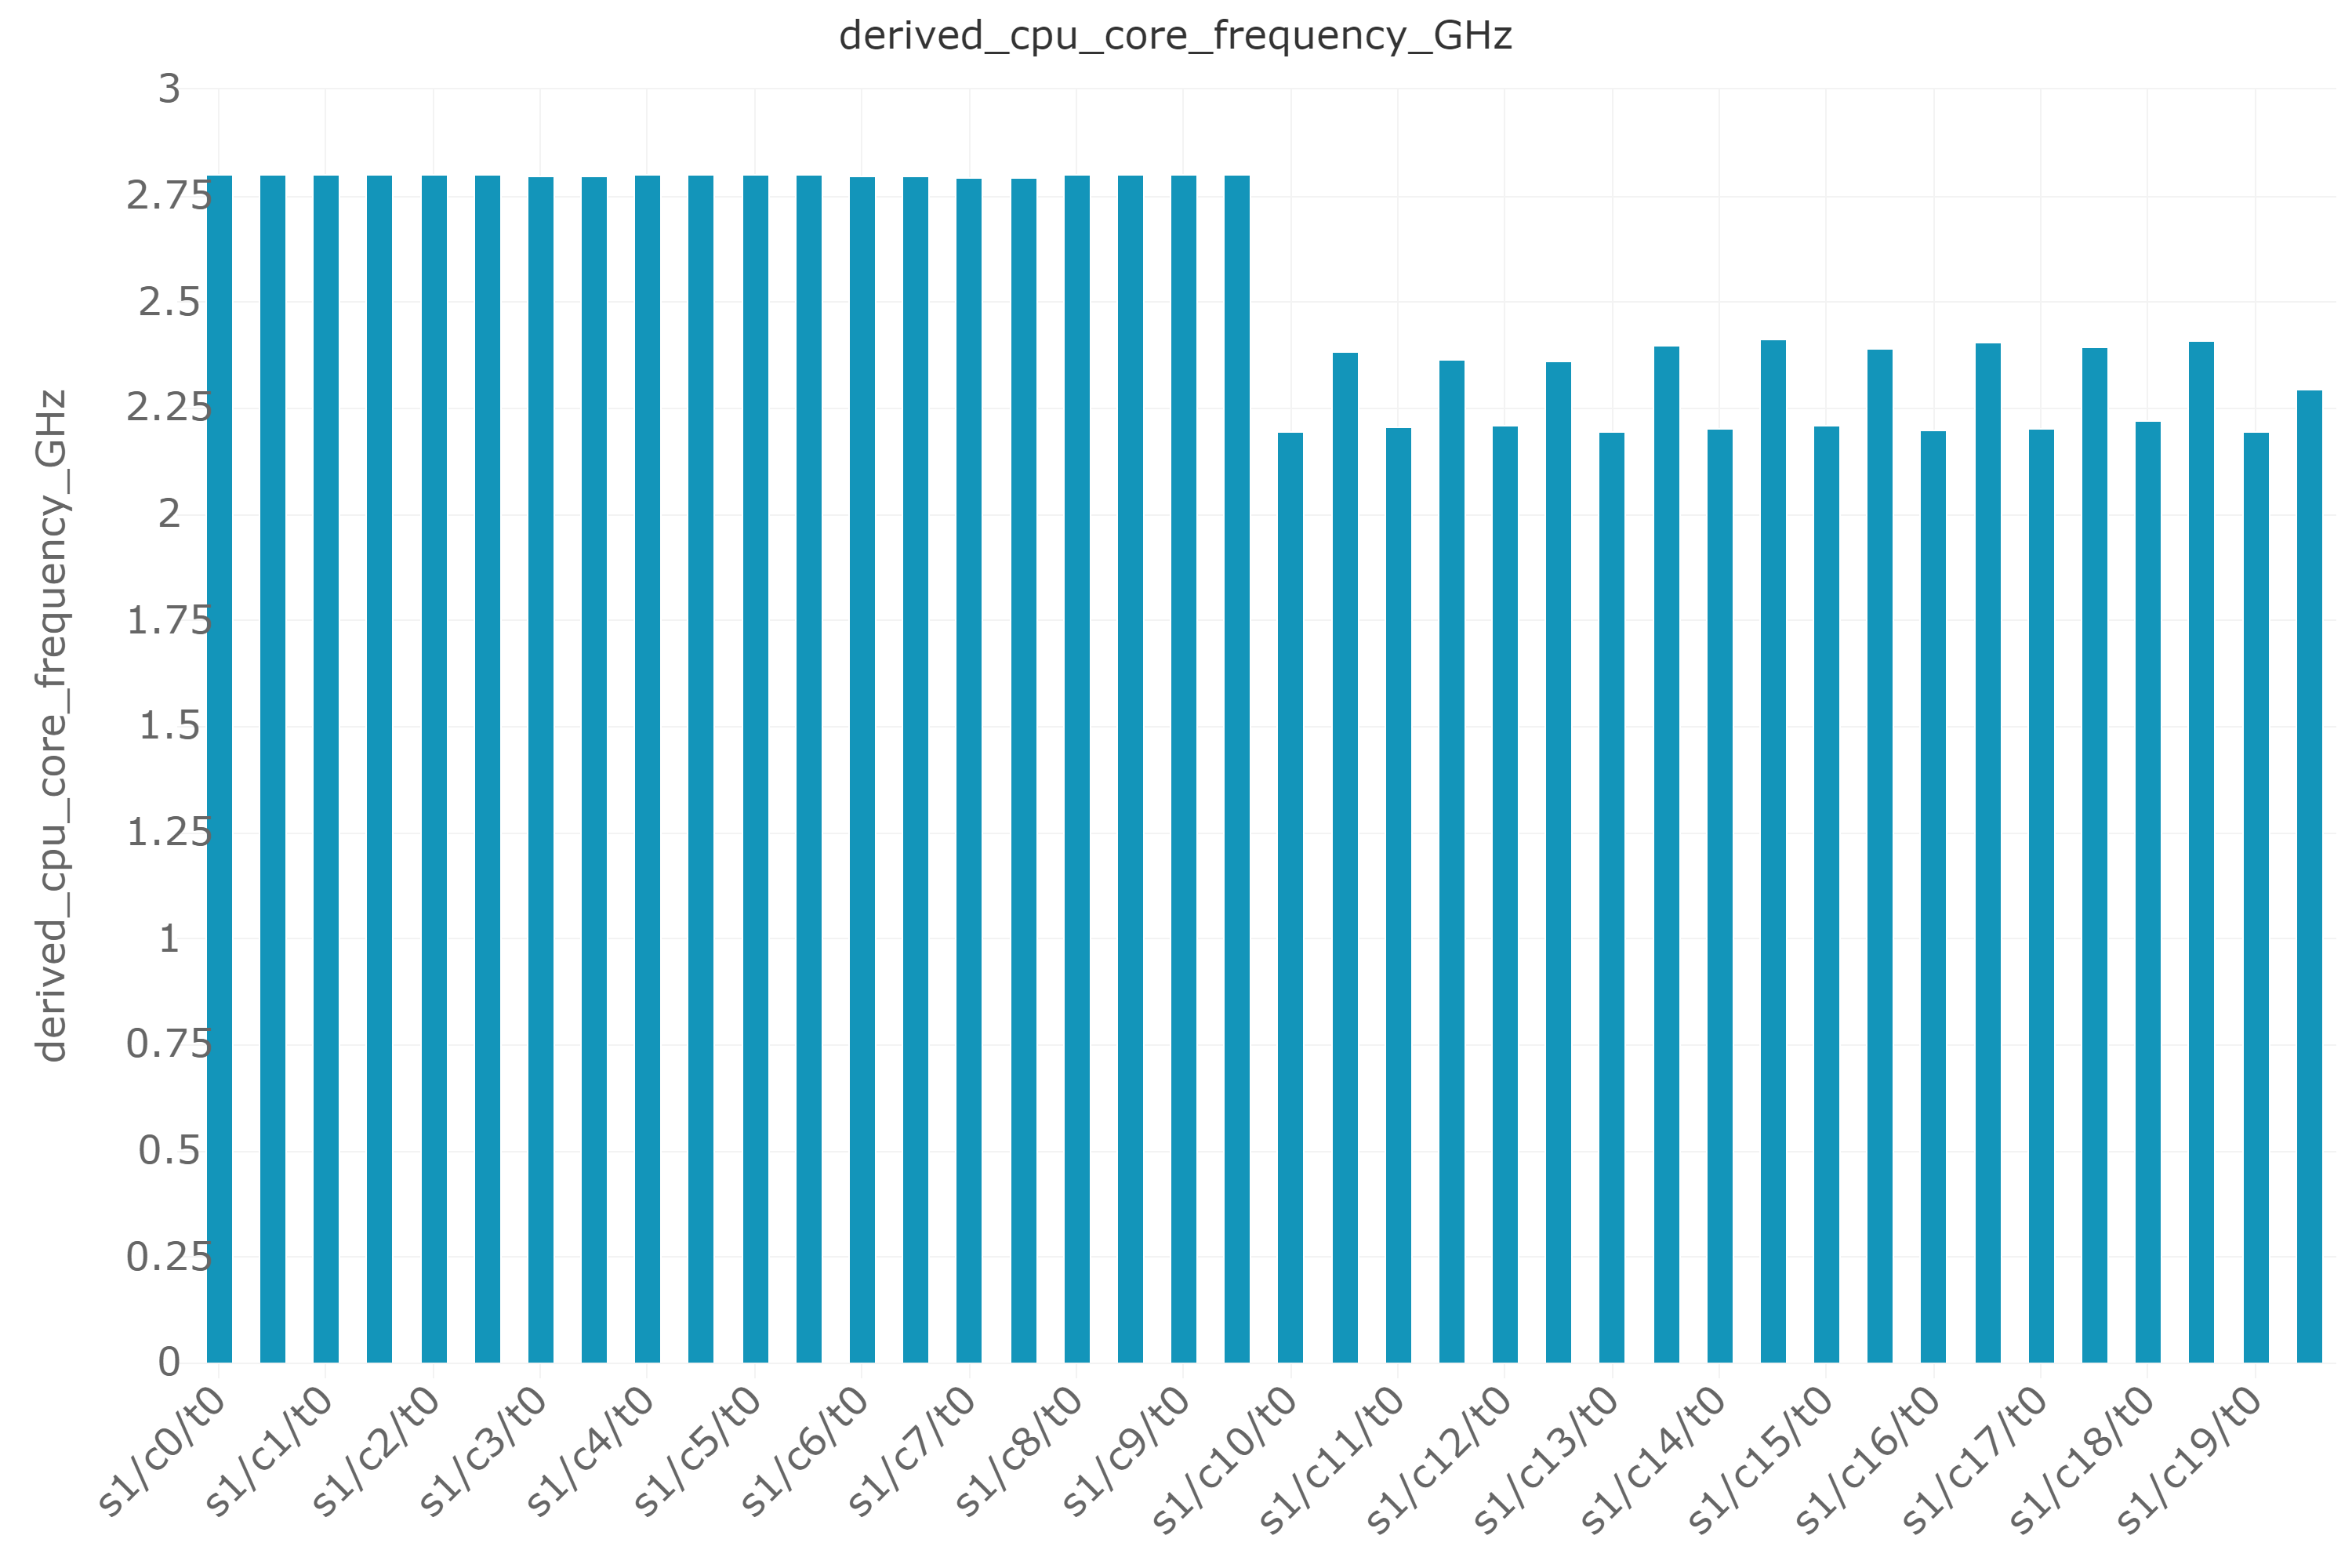
Figure 6: CPU Core frequency using CPU groups
The x-axis follows the naming convention of socket/core/thread – for example, s1/c1/t0 represents socket1/core1/thread1. The Resnet50 VM is hosted on socket 1 and pinned to the last 20 logical processors. The y-axis represents the CPU core frequency in GHz.
The last 20 LPs, where the AVX-512 instructions are being executed by the Resnet50 workload, experience down clocking. The workload runs one thread on each physical core so we can see that thread 0 on each of the 10 physical cores is running at a lower frequency of about 2.2GHz. The average frequency across all the 20 LPs of the VM is 2.28Ghz while the rest of the LPs executing the Diskspd microbenchmark are running at turbo frequencies of about 2.8GHz. This is a clear indication of the fact that cores running AVX-512 instructions experience an expected down clocking compared to turbo frequencies, and this occurs only on the cores running the AVX-512 instructions and not the whole socket. Thus, by using CPU groups for the workload running the AVX-512 instructions, the expected core frequency down-clocking can be isolated from other workloads running simultaneously on the same node.
Mixed Workloads Scenario
To understand the behavior of an AI workload like Resnet50 in a mixed workload scenario, we conducted an experiment with 1 VM (20VPs,40GB – pinned with CPU groups) running Resnet50 and 15VMs (4VPs,8GB each – pinned with CPU groups) running storage intensive microbenchmark Diskpsd together. This configuration was chosen in order to replicate a real-world scenario where the host node could be equally subscribed (80LPs) when running multiple workloads simultaneously. The Diskspd microbenchmark was run with the following configuration - 100% reads, 4K block sizes, queue depth of 4 and with 8 threads. The Turbo power setting in the BIOS was kept OFF in order to reduce run-to-run variance.
The result of this mixed workload scenario is an increase in average time per iteration of the Resnet50 workload by 88.64% and a reduction in throughput (images/sec) by about 46.81% as seen in table 7. Note that the degree of reduction in throughput will depend on the workloads running simultaneously. If there is lesser load from the surrounding workloads, the impact to the throughput and latency of the Resnet50 workload would be lesser.
The new factor in the scenario is the storage intensive microbenchmark which brings in significant root activity. The root VP run time % increases from ~2% to about 18-40% on certain LPs that the Resnet50 VM is pinned to. CPU groups does not restrict root activity, so the root activity can execute on the LPs that the Resnet50 VM is pinned to.
Quick dive into Hyper-V architecture [16]:

Figure 7: Hyper-V high-level architecture
The root partition is the first partition to be created and it is managed directly by Hyper-V. It provides memory manager for virtual machines, virtualized I/O devices, and APIs. Each VM runs on a child partition. Child partitions use their virtualization service client (VSCs) to request any I/O operations to the devices that are exposed as services over VMBus (I/O bus for VMs). These services are provided by the virtualization service provider from the root partition.
In order to understand a bit more of the Resnet50 workload behavior, we collected a function stack trace using the Intel VTune Profiler [15] for the single workload and mixed workloads scenario. Intel VTune profiler collects key application profiling data and one of its goals is to expose the top hot functions for performance bottleneck analysis. The spin time of the CPU increased significantly in the mixed workloads case due to a function called kmp_fork_barrier. OpenMP* has a fork join model of parallel execution – when a parallel construct is encountered by a thread, it spawns slave threads and all the threads execute the parallel tasks. When a thread completes its task in the parallel region, it waits at an implicit barrier at the end of the parallel construct, for other threads to complete their tasks. Once all the threads arrive at the barrier, the team of threads leaves the barrier.
In this case, the spin time increases in the mixed workload scenario as the threads end up taking longer to execute their tasks due to root activity interference and thus end up waiting longer at the fork barrier.
This is also illustrated by the last column in the table where we isolated root activity from the Resnet50 workload by using minroot. Minroot is a Hyper-V resource control setting that gives us the ability to dedicate a subset of host processors to the root partition [11]. By default, the root partition can allocate its request to any available cores in the platform. For our scenario, we allocated 40 (out of 80 LPs, with 20 on each socket) host processors to the root partition so the root activity would be isolated from the processors on which the Resnet50 workload is running. The throughput immediately shoots up by 106.77% as root interference is eliminated. In fact, the throughput is slightly higher than the single workload scenario since we are completely isolating the root activity from it. Compute intensive workloads are bound to get affected by root intensive workloads, so minroot can be used to alleviate that, except with a penalty of having fewer cores for the root partition.
| Metric |
Resnet50 (1VM) (no CPU groups) |
Diskspd (15VMs) (no CPU groups) |
Diskspd (15VMs)+Resnet50 (1VM) (all VMs pinned using cpu groups) |
|
|---|---|---|---|---|
|
|
|
|
|
with min root |
| Avg time/iteration (s) |
0.088 |
|
0.166 |
0.08 |
| Images/sec |
361 |
|
192 |
397 |
| Diskspd Read IOPs |
|
275K |
262K |
269K |
| Diskspd Avg. latency (ms) |
|
1.74 |
1.83 |
1.8 |
Table 8: Comparing the Resnet50 throughput in a mixed workload scenario and with minroot
The usage of minroot must be carefully examined because it may impact workloads who demand more of it. For compute intensive workloads, there is little usage of root resources, however for storage and network intensive workloads, they drive more root activity. Defining the number of cores for the root partition is not a trivial task [11], so it is important to know your workloads inside out, and it is recommended to plan the infrastructure set up carefully. Before deploying minroot on a production environment, it is recommended to test it on a non-production validation environment that is as close as possible to the production one.
Conclusions
This study illustrates the performance aspect of running an AI inferencing workload on a Microsoft Azure Stack HCI solution with an underlying support of the Intel Deep Learning Boost Technology. With the backing of data and an in-depth performance analysis, we highlight the best OS and platform tuning practices while inferencing on Azure Stack HCI.
The experiments shown above emphasize three main points:
1. When running multiple instances of the Resnet50 workload, the usage of CPU groups can help achieve improvement in throughput (images/sec) by reducing the VP to LP migrations. We observed an improvement of 7.1% in throughput by reducing the VP to LP migrations by 29.52% using CPU groups.
2. Using AVX-512 instructions results in frequency down clocking only on the cores running those instructions and not the full socket. By using CPU groups for the workload running the AVX-512 instructions, the expected core frequency down-clocking can be isolated from other workloads running simultaneously on the same node.
3. In a mixed workload scenario, running a compute intensive inferencing workload like Resnet50 and a root intensive storage microbenchmark like Diskspd can negatively impact the throughput of Resnet50. We observed an increase in the average time per iteration of the Resnet50 workload by 88.64% and decrease in throughput (images/sec) by 46.81%. This can be alleviated by using minroot to isolate root activity from the Resnet50 workload. By isolating the root to 20 cores, we observed an improvement in throughput by 106.77% as compared to running without minroot. The usage of minroot does have a penalty of having fewer cores for the root so it should be planned and used accordingly.
In conclusion, with the Intel Deep Learning Boost technology, AI inferencing workloads can run without any limitations on Azure Stack HCI while taking advantage of the failover clustering and live migrations features. We can achieve optimal performance of the inferencing workloads by properly planning the infrastructure and having the appropriate platform and system tunings.
References
[3] https://www.intel.ai/lowering-numerical-precision-increase-deep-learning-performance/#gs.0475pj
[4] https://lemire.me/blog/2018/09/07/avx-512-when-and-how-to-use-these-new-instructions/
[5] https://software.intel.com/sites/default/files/m/d/4/1/d/8/Intro_to_Intel_AVX.pdf
[6] https://software.intel.com/en-us/articles/introduction-to-intel-advanced-vector-extensions
[9] https://docs.oracle.com/cd/E19205-01/819-5270/aewbc/index.html
[12] https://github.com/IntelAI/models
[14] https://software.intel.com/en-us/ai
[15] https://software.intel.com/en-us/vtune
[18] https://software.intel.com/en-us/articles/introduction-to-intel-advanced-vector-extensions
[19] https://software.intel.com/en-us/articles/intel-avx-512-instructions
[21] https://software.intel.com/en-us/download/emon-user-guide
[22] https://www.microsoft.com/en-us/cloud-platform/azure-stack-hci-catalog
[23] https://www.intel.com/content/www/cn/zh/artificial-intelligence/deep-learning-boost.html
Disclaimers
Software and workloads used in performance tests may have been optimized for performance only on Intel microprocessors. Performance tests, such as SYSmark and MobileMark, are measured using specific computer systems, components, software, operations and functions. Any change to any of those factors may cause the results to vary. You should consult other information and performance tests to assist you in fully evaluating your contemplated purchases, including the performance of that product when combined with other products. For more complete information, visit intel.com/benchmarks. Performance results are based on testing as of the date set forth in the configurations and may not reflect all publicly available security updates. See configuration disclosure for details. No product or component can be absolutely secure. Cost reduction scenarios described are intended as examples of how a given Intel-based product, in the specified circumstances and configurations, may affect future costs and provide cost savings. Circumstances will vary. Intel does not guarantee any costs or cost reduction. Intel processor numbers are not a measure of performance. Processor numbers differentiate features within each processor family, not across different processor families: Learn About Intel® Processor Numbers. Intel does not control or audit third-party benchmark data. You should review this content, consult other sources, and confirm whether referenced data are accurate. Intel’s compilers may or may not optimize to the same degree for non-Intel microprocessors for optimizations that are not unique to Intel microprocessors. These optimizations include SSE2, SSE3, and SSSE3 instruction sets and other optimizations. Intel does not guarantee the availability, functionality, or effectiveness of any optimization on microprocessors not manufactured by Intel. Microprocessor-dependent optimizations in this product are intended for use with Intel microprocessors. Certain optimizations not specific to Intel microarchitecture are reserved for Intel microprocessors. Intel technologies’ features and benefits depend on system configuration and may require enabled hardware, software or service automation. Performance varies depending on system configuration. No product or component can be absolutely secure. Check with your system manufacturer or retailer or learn more at intel.com. The products described may contain design defects or errors known as errata which may cause the product to deviate from published specifications. Current characterized errata are available on request. No license (express or implied, by estoppel or otherwise) to any intellectual property rights is granted by this document. Intel, the Intel logo, Xeon, and Optane are trademarks of Intel Corporation or its subsidiaries in the U.S. and/or other countries. © Intel Corporation. Other names and brands may be claimed as the property of others. 0320/JGAL/KC/PDF 341108-001US