Introduction
This article describes how to use Intel® Advisor and Intel® VTune™ Amplifier in a Linux* distributed environment. While specifically designed to collect performance data at the node and core level, both tools can be used with MPI. The document covers basic utilization with an MPI launcher from the command line, as well as more advanced customizations.
Running a profiler at scale is often interesting for problems that may not be reduced to execution on a single node. While in some cases reducing the workload size is an effective way to save time and effort in the profiling stages, it is often difficult to determine what minimum workload size may be used per node without modifying the performance characteristics of full production cases.
It is important to remember that a separate tool exists to record the details of the communication patterns and communication costs of an MPI application, the Intel® Trace Analyzer and Collector. The information provided by VTune Intel Amplifier and Intel Advisor is focused on the core and node performance, and complements the specific MPI communication details provided by the Intel® Trace Analyzer and Collector.
Unless mentioned explicitly in the text, the MPI task counts and node numbers used in the examples are not special in any way, and do not represent limitations of the tools. Note that this document is not intended to serve as a complete description on how to use Intel VTune Amplifier or Intel Advisor, and will assume that the environment has been setup in advance by sourcing the relevant files.
Intel® VTune™ Amplifier with MPI codes
The latest version of Intel VTune Amplifier contains improved reporting on MPI related metrics, and it is extremely simple to use from the command line. In general, the simplest way to execute it in a distributed environment is:
<mpilauncher> [options] amplxe-cl [options] -r [results_dir] -- <application> [arguments]
In a distributed environment the results directory name is a requirement and may not be left blank. Intel VTune Amplifier will exit immediately with an appropriate message if an output directory name is not provided.
Let’s see an example using the Intel® MPI Library launcher, mpirun, and the pre-defined collection hpc-performance. Assuming that the application of interest is run using 64 MPI ranks and 16 ranks per node, the command line would look like this:
mpirun –np 64 –ppn 16 amplxe-cl –collect hpc-performance –r ./hpc_out -- ./app
This will generate four directories, with names starting with hpc_out and followed by a dot and the host name for each of the nodes. If the host names are node1, node2, node3, and node4 the output directories would be: hpc_out.node1, hpc_out.node2, hpc_out.node3, hpc_out.node4. Within each directory there will be sixteen data directories, one per rank executed in the node.
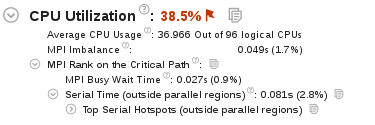 When run in this manner Intel VTune Amplifier presents data regarding MPI imbalance and some details regarding the MPI rank in the critical path of execution in the Summary. This is shown in the CPU Utilization section, as shown in the figure to the left.
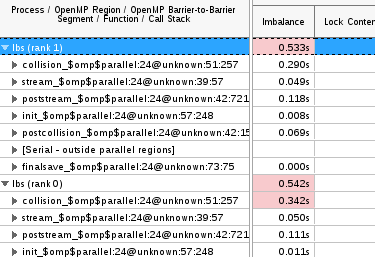 It also allows for grouping functions under each process so that they can be compared directly in the Bottom-up tab. The figure on the right shows details for the first two ranks of an application named lbs. This ability to compare MPI process performance to one another can provide insights into load balancing issues and other performance characteristics critical for scalability.
It is important to note that, if not using the Intel® MPI Library, the command line must add the option -trace-mpi for Intel VTune Amplifier to be able to collect MPI rank information and display it as described above. For details on the many capabilities and command line options available, please visit the Intel VTune Amplifier Documentation Site.
mpirun –np 64 –ppn 16 amplxe-cl –collect hpc-performance –r ./hpc_out -- ./app
Intel® Advisor with MPI codes
Intel Advisor can be run from the command line in a similar manner to Intel VTune Amplifier:
<mpilauncher> [options] advixe-cl [options] -- <application> [arguments]
An output directory name is not a requirement, since a directory will be created for each MPI rank used in the execution. Let’s consider a survey study using 64 MPI ranks and 16 ranks per node:
mpirun –np 64 –ppn 16 advixe-cl –collect survey -- ./app
This generates 64 output directories named rank.0, rank.1, ... rank.63. While Intel Advisor does not automatically aggregate multiple rank data, this collection allows for manually studying the differences across ranks. Data for each rank can be loaded separately into the GUI for further analysis.
The example shown above corresponds to just one of the many collection types available in Intel Advisor. For additional information on the extensive capabilities and command line options available please consult the Intel Advisor Documentation Site. For a more detailed description of the remote collection process you can read the in-depth article Analyzing Intel® MPI applications using Intel Advisor.
Selective MPI rank profiling
You can use selective profiling to reduce the size of the results collected by Intel Advisor and Intel VTune Amplifier. In many cases valuable information can be obtained by profiling a subset of all the MPI ranks involved. Typical profiling runs would include profiling all the MPI ranks inside a node, or a single MPI rank on each node.
When using Intel® MPI Library version 5.0.2 or newer the gtool option may be used to restrict the collection to a subset of ranks:
mpirun –np 64 –ppn 16 –gtool “amplxe-cl –collect hpc-performance –r hpc_out :0-15” ./app
In this example Intel VTune Amplifier will generate a single directory, with name “hpc_out.node1. Inside of this directory there will be sixteen data directories with the profiling information for MPI ranks 0 through 15.
It is also possible, but more cumbersome, to do this with a configuration file or through command line arguments. When using the Intel® MPI Libary the command above can be executed as:
mpirun –host node1 –n 16 amplxe-cl –collect hpc-performance –r hpc_out :0-15 ./app : –host node2 –n 16 ./app : –host node3 –n 16 ./app : –host node4 –n 16 ./app
Or simply creating a configuration file with the following content:
$ cat ./config.txt
-host node1 –n 16 amplxe-cl –collect hpc-performance –r hpc_out :0-15 ./app
-host node2 –n 16 ./app
-host node3 –n 16 ./app
-host node4 –n 16 ./app
And then using it with the mpi launcher:
mpirun –configfile ./config.txt
If not using the Intel® MPI Library, please check your MPI provider documentation for information on how to execute heterogeneous workloads.
Simultaneous Intel® Advisor and VTune™ Amplifier collections
The ability to perform selective MPI rank profiling means that you can easily use Intel VTune Amplifier to profile activity in one node, while collecting core performance data with Intel Advisor for a rank in a different node. The following example collects performance data for the first node using Intel VTune Amplifier, and core performance data for the first rank on the second node using Intel Advisor:
mpirun -np 64 –ppn 16 -gtool "amplxe-cl -collect hpc-performance -r hpc_perf -- ./app :0-15" -gtool "advixe-cl -collect survey -- ./app :16" ./app
This run will generate a single hpc_perf.node1 directory with 16 data directories inside - one per MPI rank. An additional rank.16 directory will be generated at the top level of the working directory with the collected Intel Advisor data.
MPI applications on Cray* systems
Basic setup
When using Cray* MPICH it will be necessary to set the PMI_NO_PROXY variable in the environment for Intel Advisor to complete its collection and analysis correctly:
$ export PMI_NO_FORK=1
Network timeouts
Software updates to Cray* MPICH may change timeout values which are relevant to running Intel Advisor. If timeouts are observed, it is recommended to increase the default values of the variables PMI_MMAP_SYNC_WAIT_TIME and PMI_CONNECT_RETRIES. Testing shows the following values are safe in most cases:
$ export PMI_MMAP_SYNC_WAIT_TIME=1800
$ export PMI_CONNECT_RETRIES=1000
Summary
It is simple to collect performance data with Intel Advisor and Intel VTune Amplifier for MPI and hybrid MPI+Threads codes, with the flexibility of profiling all ranks or a just subset of them. The command lines for both tools follow the standards described in their user guides and require no special configuration other than the minor details presented in this article.